. 2011 Jun 15;31(24):9043-54.
doi: 10.1523/JNEUROSCI.5410-10.2011.

PKA phosphorylation of NDE1 is DISC1/PDE4 dependent and modulates its interaction with LIS1 and NDEL1

Affiliations

PKA phosphorylation of NDE1 is DISC1/PDE4 dependent and modulates its interaction with LIS1 and NDEL1

Nicholas J Bradshaw et al. J Neurosci. .

Abstract

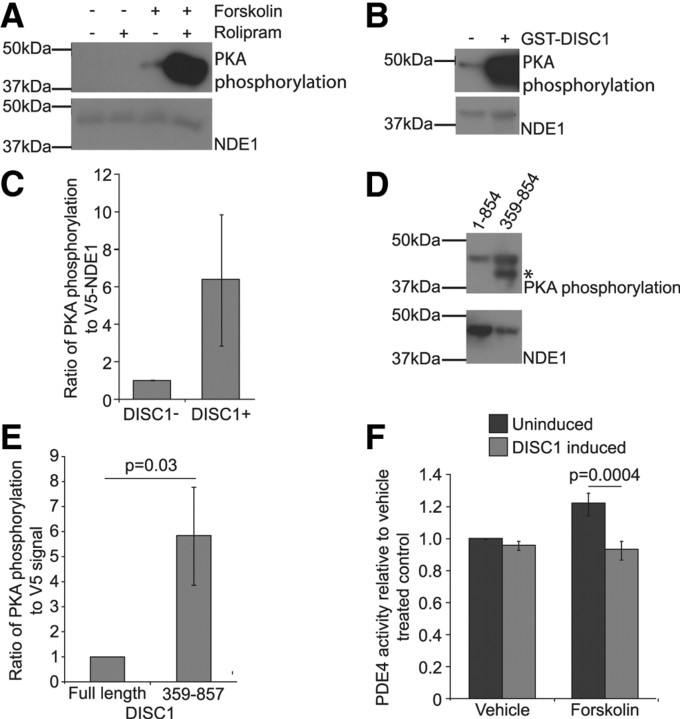
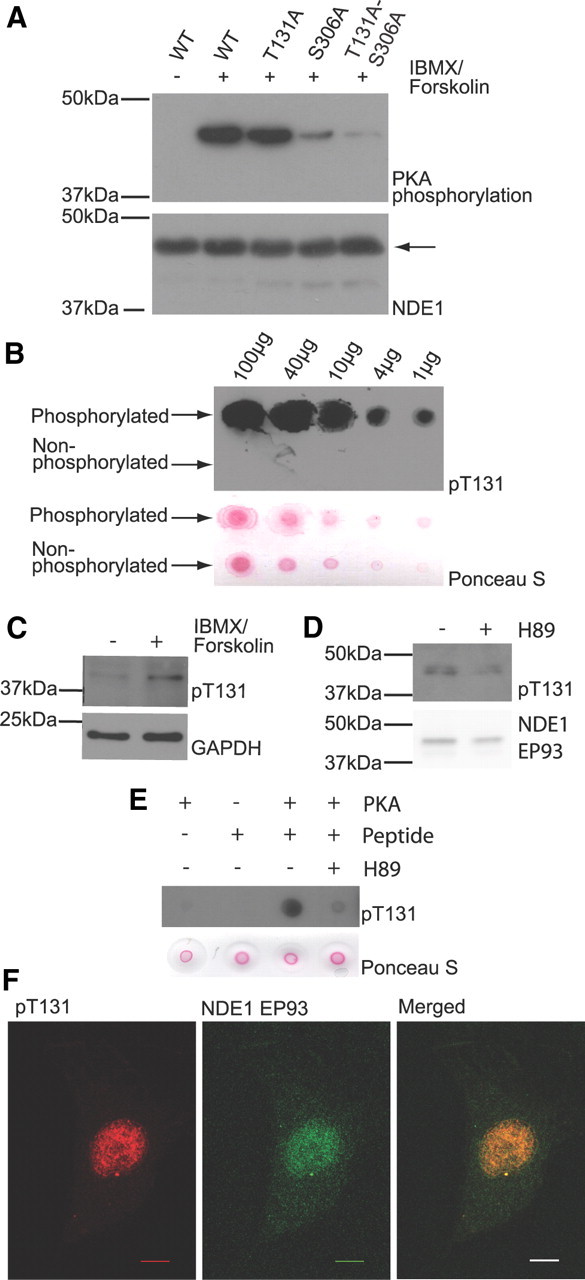
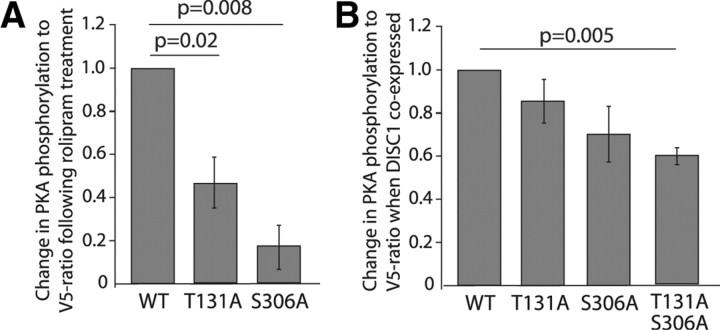
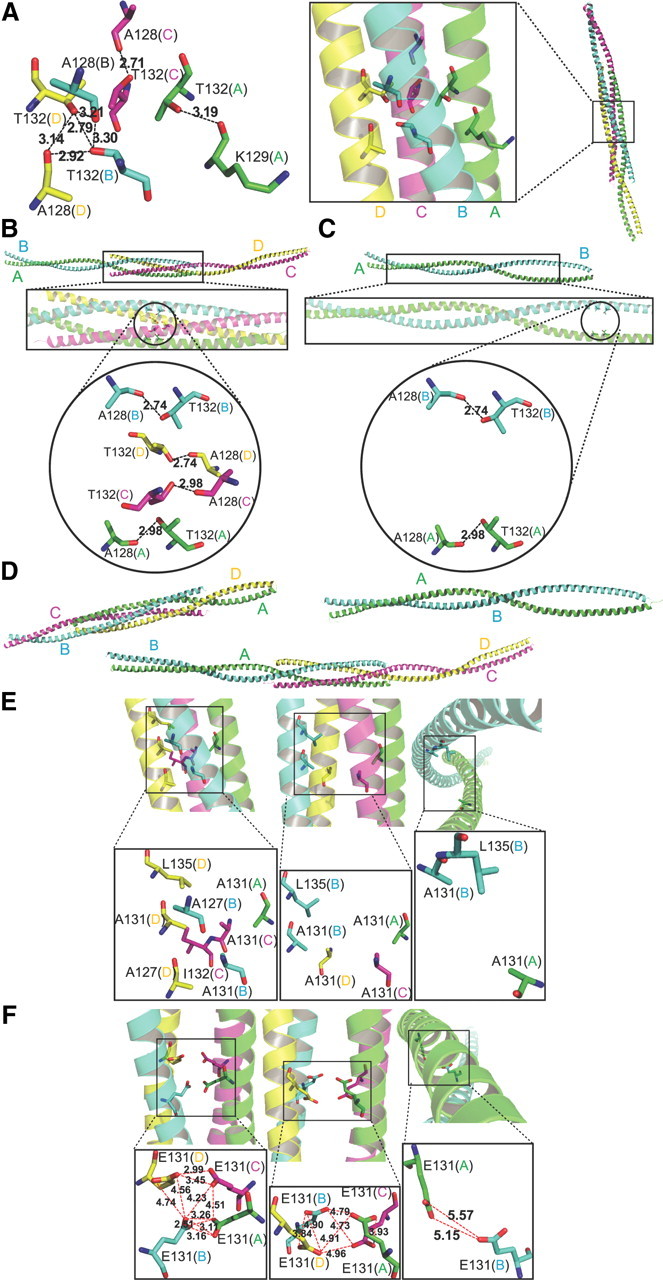
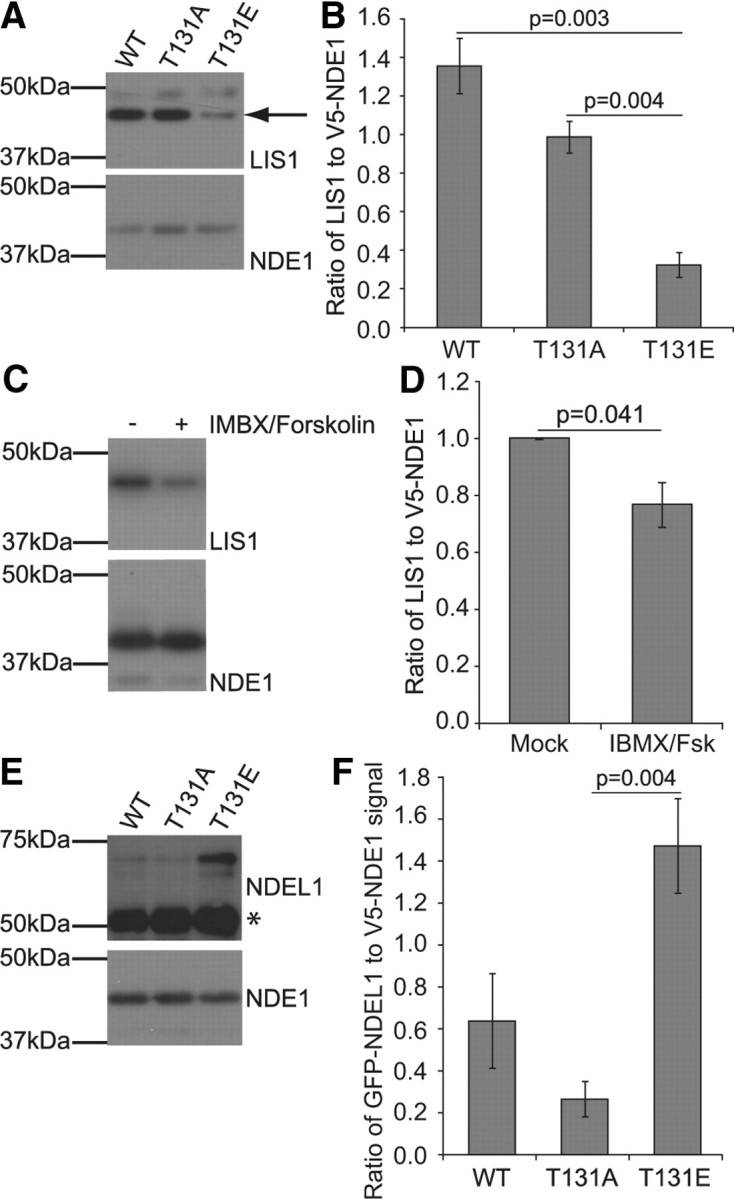
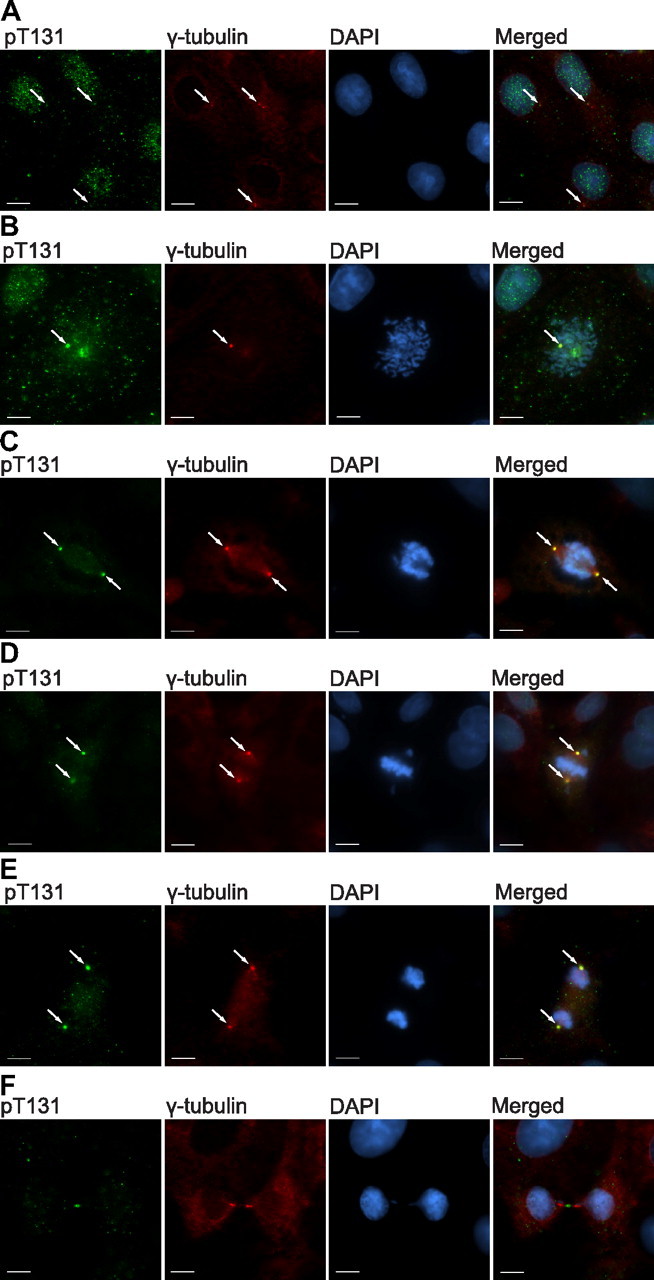
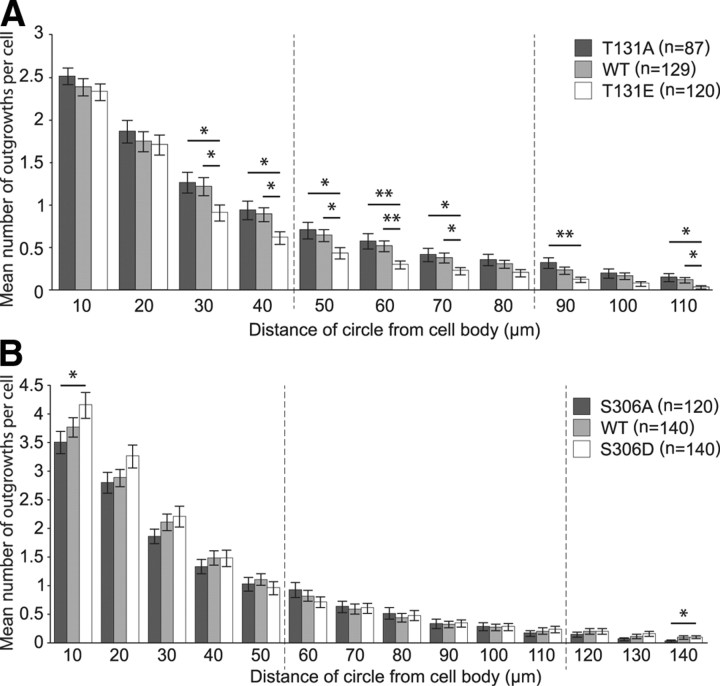
Nuclear distribution factor E-homolog 1 (NDE1), Lissencephaly 1 (LIS1), and NDE-like 1 (NDEL1) together participate in essential neurodevelopmental processes, including neuronal precursor proliferation and differentiation, neuronal migration, and neurite outgrowth. NDE1/LIS1/NDEL1 interacts with Disrupted in Schizophrenia 1 (DISC1) and the cAMP-hydrolyzing enzyme phosphodiesterase 4 (PDE4). DISC1, PDE4, NDE1, and NDEL1 have each been implicated as genetic risk factors for major mental illness. Here, we demonstrate that DISC1 and PDE4 modulate NDE1 phosphorylation by cAMP-dependent protein kinase A (PKA) and identify a novel PKA substrate site on NDE1 at threonine-131 (T131). Homology modeling predicts that phosphorylation at T131 modulates NDE1-LIS1 and NDE1-NDEL1 interactions, which we confirm experimentally. DISC1-PDE4 interaction thus modulates organization of the NDE1/NDEL1/LIS1 complex. T131-phosphorylated NDE1 is present at the postsynaptic density, in proximal axons, within the nucleus, and at the centrosome where it becomes substantially enriched during mitosis. Mutation of the NDE1 T131 site to mimic PKA phosphorylation inhibits neurite outgrowth. Thus PKA-dependent phosphorylation of the NDE1/LIS1/NDEL1 complex is DISC1-PDE4 modulated and likely to regulate its neural functions.


Figures

Figure 1.
Figure 1.
Effect of PDE4 and DISC1 on PKA phosphorylation of NDE1. A, COS7 cells were transfected with V5-tagged NDE1 and treated with rolipram and/or forskolin in two independent experiments. The expressed NDE1 was then immunoprecipitated using an anti-V5 antibody. Top, Detection of PKA phosphorylation in the anti-V5 immunoprecipitate using an antibody that detects the amino acid sequence (R/K)RX(S/T), the canonical target site for phosphorylation by PKA, but only when the serine/threonine is phosphorylated. This demonstrates the presence of a PKA-phosphorylated species in the immunoprecipitate. Bottom, NDE1 loading control detected using the V5 antibody demonstrates that the PKA-phosphorylated species detected in the top panel conforms to the molecular weight of V5-tagged NDE1 and that apparent changes in phosphorylation are not caused by variation in the level of total V5-NDE1. B, COS7 cells were transfected with V5-tagged NDE1, with or without GST-tagged DISC1. Top, Detection of PKA phosphorylation in anti-V5 immunoprecipitates using the PKA substrate antibody. Bottom, NDE1 loading control detected using the V5 antibody. C, Densitometric analysis of three independent experiments as described in B. D, COS7 cells were transfected with V5-tagged NDE1 plus GST-tagged DISC1 (either full length or amino acids 359–854 only). Top, Detection of PKA phosphorylation in anti-V5 immunoprecipitates using the PKA substrate antibody. An additional novel, ∼40 kDa PKA-phosphorylated species (asterisk) is also immunoprecipitated. This may be an NDE1-interacting protein that is also PKA phosphorylated. Bottom, NDE1 loading control detected using the V5 antibody. E, Densitometric analysis of three independent experiments as described in D. F, PDE4 activity assays in the inducible DISC1-expressing cell line TRTODISC1 with or without forskolin treatment.
Figure 2.
Figure 2.
T131 as a novel PKA substrate site on NDE1 and localization pattern of phosphorylated NDE1. A, COS7 cells were transfected with V5-tagged NDE1, either wild type (WT) or mutated. PKA phosphorylation of NDE1 in anti-V5 immunoprecipitates were examined on immunoblots using an anti-PKA substrate antibody in three independent experiments. Top, PKA phosphorylation detected using the PKA substrate antibody. Bottom, NDE1 loading control detected using the V5 antibody. The arrow marks NDE1 signal. B, Top, The pT131 antibody detects an NDE1 peptide, CDLERAKRA(pT)IM, containing phosphorylated T131, but does not recognize an otherwise identical unphosphorylated peptide. Bottom, Ponceau S loading control. The contrast was adjusted uniformly using Adobe Photoshop for clarity. C, Top, the pT131 antibody detects an endogenous NDE1-sized protein species in HEK293 lysates. This species is more abundant in cells that have been treated with IBMX plus forskolin to raise cellular cAMP levels and enhance PKA activity. Bottom, GAPDH loading control. D, Top, The signal detected by the pT131 antibody in COS7 cells treated with IBMX plus forskolin is reduced by treatment with the PKA-specific inhibitor H89. Bottom, NDE1 loading control detected using antibody EP93. E, The pT131 antibody detects the NDE1 peptide CDLERAKRATIM (T131 in italics) after incubation with recombinant PKA in vitro. This effect is inhibited by the PKA inhibitor H89. Bottom, Ponceau S loading control. The contrast was adjusted uniformly using Adobe Photoshop for clarity. F, The pT131 antibody (red) and the anti-NDE1 EP93 antibody (green) both detect the same signal at the centrosome and nucleus of COS7 cells by confocal microscopy. Scale bar, 10 μm.
Figure 3.
Figure 3.
The effect of rolipram and DISC1 on individual PKA substrate sites of NDE1. A, The relative increase in phosphorylation of V5-tagged NDE1 caused by application of rolipram plus forskolin, compared with forskolin alone, is decreased when either the T131 or S306 residue of NDE1 is mutated to alanine. Densitometric analysis of three independent Western blot experiments is shown. B, The increase in phosphorylation of V5-tagged NDE1 caused by expression of GST-DISC1 compared with GST alone is only subtly decreased when either the T131 or S306 residue of NDE1 is mutated to alanine, although this is more pronounced when a double mutant is used. Densitometric analysis of three independent Western blot experiments is shown.
Figure 4.
Figure 4.
NDEL1 crystal structures and NDE1 homology-derived three-dimensional models. A–C, The high-resolution NDEL1 coiled-coil crystal structures (at various levels of zoom) showing the location and inter-side-chain and intra-side-chain H-bonding network of T132 with neighboring amino acid residues within the short tetramer (PDB identification 2V66) (A), long tetramer generated using symmetry operations (PDB identification 2V71) (B), and long dimer (PDB identification 2V71) (C). Chains and residues are colored and labeled independently, and H-bonding (dashed lines) distances are shown in angstroms. D, Homology-based three-dimensional models of NDE1 show intact wild type (T131) for each equivalent oligomeric state for the coiled-coil regions (left, short tetramer; middle, long tetramer; right, long dimer), generated from the three NDEL1 templates. E, The T131A NDE1 SCWRL models (close-up fragment view of the three models; left, short tetramer; middle, long tetramer; right, long dimer) with corresponding hydrophobic interactions of A131 is shown. F, The T131E NDE1 SCWRL models, close-up fragment view arranged as in E revealing unsatisfactory close contacts between corresponding E131 side chains [some of these “close-contact” distances are shown in angstroms (red dashed lines) and should not to be mistaken for H-bonds].
Figure 5.
Figure 5.
Effect of PKA phosphorylation of NDE1 on NDE1/LIS1 and NDE1/NDEL1 protein interactions. A, COS7 cells were transfected with V5-tagged NDE1, either wild type or mutant, and treated with IBMX plus forskolin. Top, Coimmunoprecipitation of endogenous LIS1. The arrow marks LIS1 signal. Bottom, NDE1 loading control detected using the V5 antibody. B, Densitometric analysis of five independent experiments as described in A. C, COS7 cells were transfected with wild-type V5-tagged NDE1 and treated with IBMX/forskolin (Fsk). Top, Coimmunoprecipitation of endogenous LIS1. Bottom, NDE1 loading control detected using the V5 antibody to reprobe the same blot. D, Densitometric analysis of four independent experiments as described in C. E, COS7 cells were transfected with V5-tagged NDE1, either wild type or mutant, plus GFP-tagged NDEL1. Top, Coimmunoprecipitation of GFP-NDEL1 (predicted size, 71 kDa) detected using a GFP-specific antibody. The ∼50 kDa band (asterisk) represents IgG. Bottom, NDE1 loading control detected using the V5 antibody. F, Densitometric analysis of five independent experiments as described in E. WT, Wild type.
Figure 6.
Figure 6.
Localization of PKA-phosphorylated NDE1/NDEL1 (antibody pT131) and γ-tubulin, in mitotic COS7 cells. Scale bars, 10 μm. White arrows indicate the centrosome or individual centrioles, as appropriate. A, Interphase; B, prophase; C, prometaphase; D, metaphase; E, anaphase; F, telophase.
Figure 7.
Figure 7.
Phosphorylated T131/T132 within neurons. A, The pT131 antibody detects phosphorylated NDE1/NDEL1 in postsynaptic density fractions (PSD1–3) and is enriched in the core PSD3 fraction compared with the synaptosomal fraction (Syn). PSD1 was yielded after extraction once with Triton X-100, PSD2 was yielded after extraction twice with Triton X-100, and PSD3 was yielded after extraction with Triton X-100 once and then with N-lauroylsarcosinate. Phosphorylated NDE1 is seen principally as an ∼50 kDa species (arrow), which is also detected using two anti-murine NDE1 antibodies, EP94 and EP95. The canonical ∼40 kDa NDE1 species (asterisk) is also seen with these two antibodies. Blots were visualized using alkaline phosphatase-conjugated antibodies and BCIP/NBT. B, The pT131 antibody signal (green) colocalizes with PSD-95 (red) in primary mouse hippocampal neurons (23 d in vitro) by confocal microscopy. Enlargements of the boxed regions are displayed. C, pT131 antibody signal (green) is enriched within proximal axons (white arrows) of both immature (9 d in vitro; top) and mature (23 d in vitro; bottom) primary mouse hippocampal neurons. Axons are defined as major neurites that do not display MAP2 staining (red). Scale bars, 10 μm.
Figure 8.
Figure 8.
NS-1 assay to investigate the effect of NDE1 mutations at T131 and S306 on neurite outgrowth. A, Sholl analysis of cells transfected with wild type, T131A, or T131E NDE1. Concentric circles, each 10 μm apart, were centered on the cell bodies of NS-1 cells. Starting from the first circle outside of the cell body and counting outward, the number of neurites from the cell that crossed each circle was counted. Only data from the first 11 circles (of 22) are displayed, as after this point there were n < 30 neurites (an average of n < 10 per NDE1 category). Vertical dashed lines indicate one and two times the length of the mean cell body (40.5 μm). *p < 0.05; **p < 0.01. B, A similar analysis of cells transfected with wild type, S306A, or S306D NDE1. Only data from the first 14 circles (of 34) are displayed, as after this point there were n < 30 neurites. Mean cell body length is 58.63 μm. WT, Wild type.

Similar articles

Cited by

References

    1. Berman HM, Westbrook J, Feng Z, Gilliland G, Bhat TN, Weissig H, Shindyalov IN, Bourne PE. The Protein Data Bank. Nucleic Acids Res. 2000;28:235–242. - PMC - PubMed
    1. Bradshaw NJ, Ogawa F, Antolin-Fontes B, Chubb JE, Carlyle BC, Christie S, Claessens A, Porteous DJ, Millar JK. DISC1, PDE4B, and NDE1 at the centrosome and synapse. Biochem Biophys Res Commun. 2008;377:1091–1096. - PubMed
    1. Bradshaw NJ, Christie S, Soares DC, Carlyle BC, Porteous DJ, Millar JK. NDE1 and NDEL1: multimerisation, alternate splicing and DISC1 interaction. Neurosci Lett. 2009;449:228–233. - PMC - PubMed
    1. Brandon NJ, Handford EJ, Schurov I, Rain J-C, Pelling M, Duran-Jimeriz B, Camargo LM, Oliver KR, Beher D, Shearman MS, Whiting PJ. Disrupted in Schizophrenia 1 and Nudel form a neurodevelopmentally regulated protein complex: implications for schizophrenia and other major neurological disorders. Mol Cell Neurosci. 2004;25:42–55. - PubMed
    1. Burdick KE, Kamiya A, Hodgkinson CA, Lencz T, DeRosse P, Ishizuka K, Elashvili S, Arai H, Goldman D, Sawa A, Malhotra AK. Elucidating the relationship between DISC1, NDEL1, and NDE1 and the risk for schizophrenia: evidence of epistasis and competitive binding. Hum Mol Genet. 2008;17:2462–2473. - PMC - PubMed

Publication types

MeSH terms