. 2011 Jun 8;31(23):8570-84.
doi: 10.1523/JNEUROSCI.2817-10.2011.

Synchrony makes neurons fire in sequence, and stimulus properties determine who is ahead

Affiliations

Synchrony makes neurons fire in sequence, and stimulus properties determine who is ahead

Martha N Havenith et al. J Neurosci. .

Abstract

The synchronized activity of cortical neurons often features spike delays of several milliseconds. Usually, these delays are considered too small to play a role in cortical computations. Here, we use simultaneous recordings of spiking activity from up to 12 neurons to show that, in the cat visual cortex, the pairwise delays between neurons form a preferred order of spiking, called firing sequence. This sequence spans up to ∼ 15 ms and is referenced not to external events but to the internal cortical activity (e.g., beta/gamma oscillations). Most importantly, the preferred sequence of firing changed consistently as a function of stimulus properties. During beta/gamma oscillations, the reliability of firing sequences increased and approached that of firing rates. This suggests that, in the visual system, short-lived spatiotemporal patterns of spiking defined by consistent delays in synchronized activity occur with sufficient reliability to complement firing rates as a neuronal code.


Figures

Figure 1.
Figure 1.
Extraction of pairwise time delays and their internal origin. A, A moving bar stimulus sweeping across a pair of overlapping RFs of neurons in cat area 17. B, CCH of the two neurons shown in A, with a zoom into the peak of the CCH to which a Gaussian is fitted to estimate the preferred time delay between the units. The shift of the center peak to the left indicates that unit B fires earlier than unit A. C, PSTHs for the same responses as in B. The vertical dashed lines indicate the approximate times at which the bar entered the receptive fields of the units, unit A being activated before unit B. Red line, The time window for which CCH is computed. D, A scatter plot between the differences in the activation latency and the time delays extracted from the CCHs, computed for 107 pairs of neurons.
Figure 2.
Figure 2.
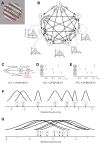
Extraction of firing sequences. A, Cluster of overlapping receptive fields of seven neurons, and the relative positioning of the grating stimuli. B, A network of seven units with all possible pairwise time delays and their directions (arrows). The original CCHs are shown for five delays. C, Illustration of the additivity between pairwise time delays using an example of three time delays extracted from B and showing the corresponding error of additivity. D, Illustrative set of action potentials for three neurons (A–C). Although neurons do not fire together as a group in the same population response, each neuron maintains its preferred relative firing time across individual spiking events. As a result, the preferred pairwise delays between neurons are additive. E, An example similar to that in D but illustrating a case in which the delays are not additive. F, The firing sequence extracted from B by applying the principle of additivity. The position of the neuron on the time axis indicates its relative preferred firing time, positive values corresponding to earlier firing. Gaussians indicate additivity errors (extent, ±2 SD). Note that the individual firing times in a given sequence always sum up to zero. G, The variability of the delays in individual coincident events is indicated by superimposing for each neuron in the sequence a Gaussian indicating the average peak width at half height of its CCHs with all other neurons.
Figure 3.
Figure 3.
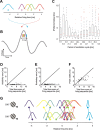
Precision of firing sequences and their relationship to the underlying oscillatory rhythm. A, A firing sequence extracted for five neurons (the average widths of the CCH peaks are shown in supplemental Fig. S3A, available at www.jneurosci.org as supplemental material). B, The firing sequence in A shown in relation to the LFP, computed as sequence-triggered average of LFP. C, Distributions of delay magnitudes for CCHs that display different oscillation frequencies. All CCHs used in the present study (n = 1351) are grouped according to the oscillation period, extracted from their FFT. The distributions of the associated delays are shown in absolute values. Red line, Median. Box ends, 25th percentile. Whiskers, The largest (smallest) data point not exceeding the box end by more than 1.5 times the box size. Red crosses, Outliers. D, E, The relationships between the total time span of the sequences on x-axes, and two different estimates of errors (additivity and bootstrap error), on y-axes. The results are shown for all 43 investigated sequences. Diagonals, Identity lines. F, The relationship between the total time span of all 43 investigated sequences and the average variability of the individual coincident events indicated by the width of the CCH center peak at half-height. G, A firing sequence estimated twice for the same neurons and in response to the same stimuli, recordings being made ∼7 h apart. The average widths of the CCH peaks are shown in supplemental Figure S3B (available at www.jneurosci.org as supplemental material).
Figure 4.
Figure 4.
Stimulus-dependent changes of preferred firing sequences. A, The firing sequence from Figure 3G (top row) changes when a grating with a different direction of the drift is presented (bottom row) (for the average widths of the CCH peaks, see supplemental Fig. S3C, available at www.jneurosci.org as supplemental material). B, Corresponding changes in the positions of the center peaks in CCHs shown for five pairs of neurons. Diamonds, The colors of the neurons in A that produced the respective CCHs. Light red, 330° direction of drift, left-side y-scale. Blue, 120° direction of drift, right-side y-scale. The dashed vertical line indicates zero time shift. C, The magnitude to which the average relative firing time of neurons changes as a function of stimulus property (ordinate) compared with the following four measures of variability (abscissa; from left to right): error of additivity, bootstrap error, error variance across repeated recordings, average width of CCH peaks. Stimulus change, Mean change of firing times across stimulation conditions (in milliseconds). Each data point is one recording.
Figure 5.
Figure 5.
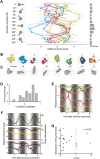
Stimulus-dependent changes of firing times are independent of firing rates. A, Firing sequence of eight neurons in response to gratings drifting in 12 different directions. Bars on the far right, The total number of action potentials available for the computation of the given firing sequence. For the average widths of the CCH peaks, see supplemental Figure S3D (available at www.jneurosci.org as supplemental material). B, Changes in the relative firing times for each unit shown in A, drawn as polar plots to facilitate comparison to the tuning of the firing rate responses. C, Tuning of the firing rate responses for the same cells as in B. D, Distribution of correlation coefficients between orientation tuning curves of firing times and firing rates for 27 SUs. E, Firing sequences calculated by a sliding-window analysis for seven SUs stimulated by a grating drifting in the preferred direction. The sinusoidal luminance pattern in the background reflects the temporal frequency of the grating. The responses are shown as a function of the time elapsed since the stimulus onset. F, Relative firing times of three units that exhibited a strong modulation of firing times in E, which we compared with the changes in the firing rates. Colored lines, Firing times with the scale on the left y-axis. Black lines, Firing rates (PSTHs) with the scale on the right y-axis. G, Modulation amplitude of firing times as a function of the modulation amplitude (F1/F0) of the rate responses of the neurons (n = 17 neurons).
Figure 6.
Figure 6.
Information content of firing sequences and firing rates. A, B, Mutual information computed for a representative example neuron (second unit from the left in Fig. 5B). Thick line, Direction tuning of the relative firing times (A), and the firing rates (B) computed for all 40 stimulus presentations (trials). Gray area, The variation of the estimates when using only half of the available trials (20 trials each). C, Proportion of transferred stimulus-related information, pMI, for firing rates and firing times. Diagonal, Equality line.
Figure 7.
Figure 7.
Dependence of coding performance on gamma oscillations. A, The relationship between the strength of beta/gamma oscillations and the amount of stimulus-related information carried by the relative firing times. B, The same as in A but for firing rates. C, The scatter of pMI values from Figure 6C but shown separately for data with strong and weak oscillations. Red, Recordings with strong oscillations. Green, Recordings with weak oscillations. D, Distributions of differences in the proportion of transmitted information (pMI) between firing rates and firing times, computed for data sets with strong (red) and weak (green) oscillations (positive values: coding advantage for firing rates). Insets, Typical autocorrelation histograms exhibiting either strong or weak oscillations.
Figure 8.
Figure 8.
Preferred firing sequences can be traced in raw spike trains. A–C, Example spike trains of 11 neurons in response to a grating, shown in the original form (A) and two shifted forms (B, C). In B, the shift of each spike train corresponds to the negative of the relative firing time of the neuron in the preferred firing sequence (correct shift). In C, the spike trains are shifted according to a preferred firing sequence obtained for a different stimulus (incorrect shift). Vertical lines, Five-millisecond-long windows within which the size of unitary events was defined as the number of spikes occurring in that window. B, C, Far right, The respective firing sequence used to shift the spike trains (calculated across 120 stimulus presentations). D, The overall frequencies with which unitary events of all sizes (maximum, 9) occurred in the data set shown in A–C, plotted on a log-linear scale. Black, Original spike trains, as in A. Red, Correct shifts, as in B. Gray, Incorrect shifts, as in C. Dashed lines, Frequencies of unitary events computed for trial-shuffled spike trains (see Materials and Methods). E, The ratios between the frequencies of unitary events in correctly shifted versus original spike trains (e.g., red vs black line in D) calculated across all data (43 firing sequences). Values >1 indicate more unitary events in the shifted than in the original spike trains. The stars indicate significance (binomial test; *p ≤ 0.05; **p ≤ 0.01) (see Materials and Methods). The stars located at the bottom edge of the panel indicate that unitary events occurred less frequently in shifted than in original spike trains. The stars located at the top edge of the panel indicate the opposite. F, Same plot as in E, but comparing incorrectly shifted spike trains with the original ones (e.g., gray vs black line in D). G, Same as E and F, but comparing correctly and incorrectly shifted spike trains. H, Frequencies of unitary events for correctly versus incorrectly shifted spike trains as in G, but split between weak and strong oscillations. Green, Averages for weakly oscillating data sets (30 sequences). Red, Averages for strongly oscillating data sets (13 sequences). Error bars indicate ±1 SD. I, Same as E, but computed for trial-shuffled spike trains.

Similar articles

Cited by

References

    1. Ahissar E, Arieli A. Figuring space by time. Neuron. 2001;32:185–201. - PubMed
    1. Alonso JM, Martinez LM. Functional connectivity between simple cells and complex cells in cat striate cortex. Nat Neurosci. 1998;1:395–403. - PubMed
    1. Azouz R, Gray CM. Adaptive coincidence detection and dynamic gain control in visual cortical neurons in vivo. Neuron. 2003;37:513–523. - PubMed
    1. Berényi A, Benedek G, Nagy A. Double sliding-window technique: a new method to calculate the neuronal response onset latency. Brain Res. 2007;1178:141–148. - PubMed
    1. Bi GQ, Poo MM. Synaptic modifications in cultured hippocampal neurons: dependence on spike timing, synaptic strength, and postsynaptic cell type. J Neurosci. 1998;18:10464–10472. - PMC - PubMed

Publication types

LinkOut - more resources