The development and functions of CD4(+) T cells expressing a transgenic TCR specific for an MHC-I-restricted tumor antigenic epitope
- PMID: 21643003
- PMCID: PMC4002444
- DOI: 10.1038/cmi.2011.14
The development and functions of CD4(+) T cells expressing a transgenic TCR specific for an MHC-I-restricted tumor antigenic epitope
Abstract
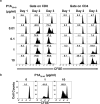
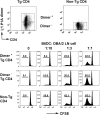
It has been reported that the ratio of CD4(+) to CD8(+) T cells has no bias in a few class I major histocompatibility complex (MHC-I)-restricted T-cell receptor (TCR)-transgenic mice specific for alloantigens or autoantigens, in which most CD4(+) T cells express an MHC-I-restricted TCR. In this study, we further showed that more than 50% of CD4(+) T cells in MHC-I-restricted P1A tumor antigen-specific TCR (P1ATCR)-transgenic mice could specifically bind to MHC-I/P1A peptide complex. P1A peptide could stimulate the transgenic CD4(+) T cells to proliferate and secrete both type 1 helper T cell and type 2 helper T cell cytokines. The activated CD4(+) T cells also showed cytotoxicity against P1A-expressing tumor cells. The analysis of TCR α-chains showed that these CD4(+) T cells were selected by co-expressing endogenous TCRs. Our results show that CD4(+) T cells from P1ATCR transgenic mice co-expressed an MHC-I-restricted transgenic TCR and another rearranged endogenous TCRs, both of which were functional.
Figures


Similar articles
-
MHC-class I-restricted CD4 T cells: a nanomolar affinity TCR has improved anti-tumor efficacy in vivo compared to the micromolar wild-type TCR.Cancer Immunol Immunother. 2013 Feb;62(2):359-69. doi: 10.1007/s00262-012-1336-z. Epub 2012 Aug 25. Cancer Immunol Immunother. 2013. PMID: 22926060 Free PMC article.
-
CD4+CD25- T cells transduced to express MHC class I-restricted epitope-specific TCR synthesize Th1 cytokines and exhibit MHC class I-restricted cytolytic effector function in a human melanoma model.J Immunol. 2008 Jul 15;181(2):1063-70. doi: 10.4049/jimmunol.181.2.1063. J Immunol. 2008. PMID: 18606658 Free PMC article.
-
Cross-positive selection of thymocytes expressing a single TCR by multiple major histocompatibility complex molecules of both classes: implications for CD4+ versus CD8+ lineage commitment.J Immunol. 2006 Feb 1;176(3):1628-36. doi: 10.4049/jimmunol.176.3.1628. J Immunol. 2006. PMID: 16424192
-
The specific regulation of immune responses by CD8+ T cells restricted by the MHC class Ib molecule, Qa-1.Annu Rev Immunol. 2000;18:185-216. doi: 10.1146/annurev.immunol.18.1.185. Annu Rev Immunol. 2000. PMID: 10837057 Review.
-
T cell receptor bias for MHC: co-evolution or co-receptors?Cell Mol Life Sci. 2014 Aug;71(16):3059-68. doi: 10.1007/s00018-014-1600-9. Epub 2014 Mar 17. Cell Mol Life Sci. 2014. PMID: 24633202 Free PMC article. Review.
Cited by
-
Combined adjuvants of poly(I:C) plus LAG-3-Ig improve antitumor effects of tumor-specific T cells, preventing their exhaustion.Cancer Sci. 2016 Apr;107(4):398-406. doi: 10.1111/cas.12861. Cancer Sci. 2016. PMID: 27079438 Free PMC article.
-
YIV-906 potentiated anti-PD1 action against hepatocellular carcinoma by enhancing adaptive and innate immunity in the tumor microenvironment.Sci Rep. 2021 Jun 29;11(1):13482. doi: 10.1038/s41598-021-91623-3. Sci Rep. 2021. PMID: 34188068 Free PMC article.
References
-
- Kisielow P, Bluthmann H, Staerz UD, Steinmetz M, von Boehmer H. Tolerance in T-cell-receptor transgenic mice involves deletion of nonmature CD4+8+ thymocytes. Nature. 1988;333:742–746. - PubMed
-
- Pircher H, Burki K, Lang R, Hengartner H, Zinkernagel RM. Tolerance induction in double specific T-cell receptor transgenic mice varies with antigen. Nature. 1989;342:559–561. - PubMed
-
- Morgan DJ, Liblau R, Scott B, Fleck S, McDevitt HO, Sarvetnick N, et al. CD8+ T cell-mediated spontaneous diabetes in neonatal mice. J Immunol. 1996;157:978–983. - PubMed
-
- McGargill MA, Mayerova D, Stefanski HE, Koehn B, Parke EA, Jameson SC, et al. A spontaneous CD8 T cell-dependent autoimmune disease to an antigen expressed under the human keratin 14 promoter. J Immunol. 2002;169:2141–2147. - PubMed
-
- Asnagli H, Schmitt-Verhulst AM, Guimezanes A. Class I- and class II-reactive TCRs coexpressed on CD4+ T cells both trigger CD4/CD8-shared and CD4-unique functions. J Immunol. 1997;158:4533–4542. - PubMed
Publication types
MeSH terms
Substances
LinkOut - more resources
Full Text Sources
Research Materials

