TLR activation enhances C5a-induced pro-inflammatory responses by negatively modulating the second C5a receptor, C5L2
- PMID: 21630250
- PMCID: PMC3638321
- DOI: 10.1002/eji.201041350
TLR activation enhances C5a-induced pro-inflammatory responses by negatively modulating the second C5a receptor, C5L2
Abstract
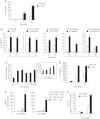
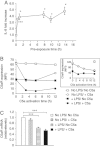
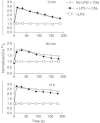
TLR and complement activation ensures efficient clearance of infection. Previous studies documented synergism between TLRs and the receptor for the pro-inflammatory complement peptide C5a (C5aR/CD88), and regulation of TLR-induced pro-inflammatory responses by C5aR, suggesting crosstalk between TLRs and C5aR. However, it is unclear whether and how TLRs modulate C5a-induced pro-inflammatory responses. We demonstrate a marked positive modulatory effect of TLR activation on cell sensitivity to C5a in vitro and ex vivo and identify an underlying mechanistic target. Pre-exposure of PBMCs and whole blood to diverse TLR ligands or bacteria enhanced C5a-induced pro-inflammatory responses. This effect was not observed in TLR4 signalling-deficient mice. TLR-induced hypersensitivity to C5a did not result from C5aR upregulation or modulation of C5a-induced Ca(2+) mobilization. Rather, TLRs targeted another C5a receptor, C5L2 (acting as a negative modulator of C5aR), by reducing C5L2 activity. TLR-induced hypersensitivity to C5a was mimicked by blocking C5L2 and was not observed in C5L2KO mice. Furthermore, TLR activation inhibited C5L2 expression upon C5a stimulation. These findings identify a novel pathway of crosstalk within the innate immune system that amplifies innate host defense at the TLR-complement interface. Unravelling the mutually regulated activities of TLRs and complement may reveal new therapeutic avenues to control inflammation.
Copyright © 2011 WILEY-VCH Verlag GmbH & Co. KGaA, Weinheim.
Figures


Similar articles
-
C5L2: a controversial receptor of complement anaphylatoxin, C5a.FASEB J. 2013 Mar;27(3):855-64. doi: 10.1096/fj.12-220509. Epub 2012 Dec 13. FASEB J. 2013. PMID: 23239822 Review.
-
C5L2 is required for C5a-triggered receptor internalization and ERK signaling.Cell Signal. 2014 Jul;26(7):1409-19. doi: 10.1016/j.cellsig.2014.02.021. Epub 2014 Mar 12. Cell Signal. 2014. PMID: 24631530
-
The interaction between C5a and both C5aR and C5L2 receptors is required for production of G-CSF during acute inflammation.Eur J Immunol. 2013 Jul;43(7):1907-13. doi: 10.1002/eji.201243075. Epub 2013 May 13. Eur J Immunol. 2013. PMID: 23575697 Free PMC article.
-
Disruption of the complement anaphylatoxin receptor C5L2 exacerbates inflammation in allergic contact dermatitis.J Immunol. 2013 Oct 15;191(8):4001-9. doi: 10.4049/jimmunol.1301626. Epub 2013 Sep 16. J Immunol. 2013. PMID: 24043888 Free PMC article.
-
Receptors for complement C5a. The importance of C5aR and the enigmatic role of C5L2.Immunol Cell Biol. 2008 Feb;86(2):153-60. doi: 10.1038/sj.icb.7100166. Epub 2008 Jan 29. Immunol Cell Biol. 2008. PMID: 18227853 Review.
Cited by
-
C5aR2 Deficiency Lessens C5aR1 Distribution and Expression in Neutrophils and Macrophages.J Immunol Res. 2024 Jul 10;2024:2899154. doi: 10.1155/2024/2899154. eCollection 2024. J Immunol Res. 2024. PMID: 39021433 Free PMC article.
-
Folic acid-mediated fibrosis is driven by C5a receptor 1-mediated activation of kidney myeloid cells.Am J Physiol Renal Physiol. 2022 Jun 1;322(6):F597-F610. doi: 10.1152/ajprenal.00404.2021. Epub 2022 Apr 4. Am J Physiol Renal Physiol. 2022. PMID: 35379003 Free PMC article.
-
Endogenous Tetrapyrroles Influence Leukocyte Responses to Lipopolysaccharide in Human Blood: Pre-Clinical Evidence Demonstrating the Anti-Inflammatory Potential of Biliverdin.J Clin Cell Immunol. 2014 May 30;5(218):1000218. doi: 10.4172/2155-9899.1000218. J Clin Cell Immunol. 2014. PMID: 25177524 Free PMC article.
-
Polymorphisms at the innate immune receptor TLR2 are associated with Borrelia infection in a wild rodent population.Proc Biol Sci. 2013 Apr 3;280(1759):20130364. doi: 10.1098/rspb.2013.0364. Print 2013 May 22. Proc Biol Sci. 2013. PMID: 23554395 Free PMC article.
-
Genetic analysis of C5a receptors in neutrophils from patients with familial Mediterranean fever.Mol Biol Rep. 2012 May;39(5):5503-10. doi: 10.1007/s11033-011-1353-6. Epub 2011 Dec 21. Mol Biol Rep. 2012. PMID: 22187344
References
-
- Kumar H, Kawai T, Akira S. Toll-like receptors and innate immunity. Biochem. Biophys. Res. Commun. 2009;388:621–625. - PubMed
-
- Walport MJ. Complement. First of two parts. N. Engl. J. Med. 2001;344:1058–1066. - PubMed
-
- Gay NJ, Gangloff M. Structure and function of Toll receptors and their ligands. Annu. Rev. Biochem. 2007;76:141–165. - PubMed
Publication types
MeSH terms
Substances
LinkOut - more resources
Full Text Sources
Molecular Biology Databases
Miscellaneous

