

Metabolic regulation of mycobacterial growth and antibiotic sensitivity
- PMID: 21629732
- PMCID: PMC3101192
- DOI: 10.1371/journal.pbio.1001065
Metabolic regulation of mycobacterial growth and antibiotic sensitivity
Abstract
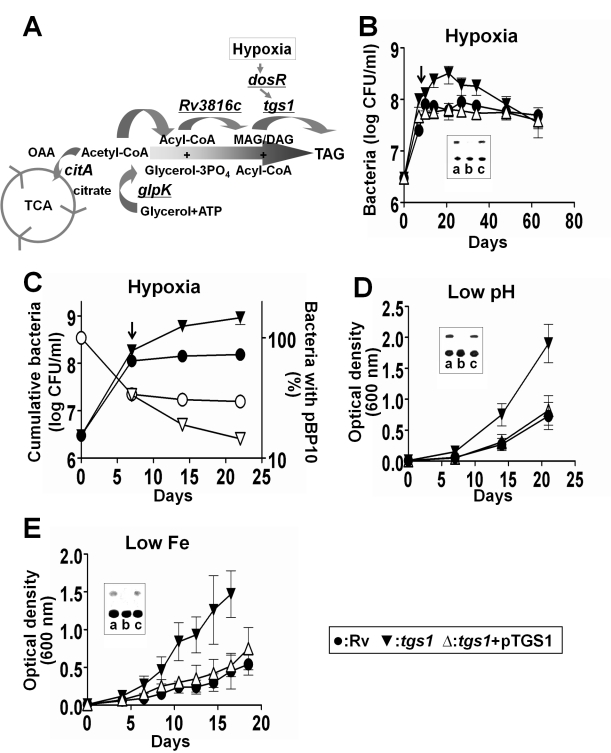
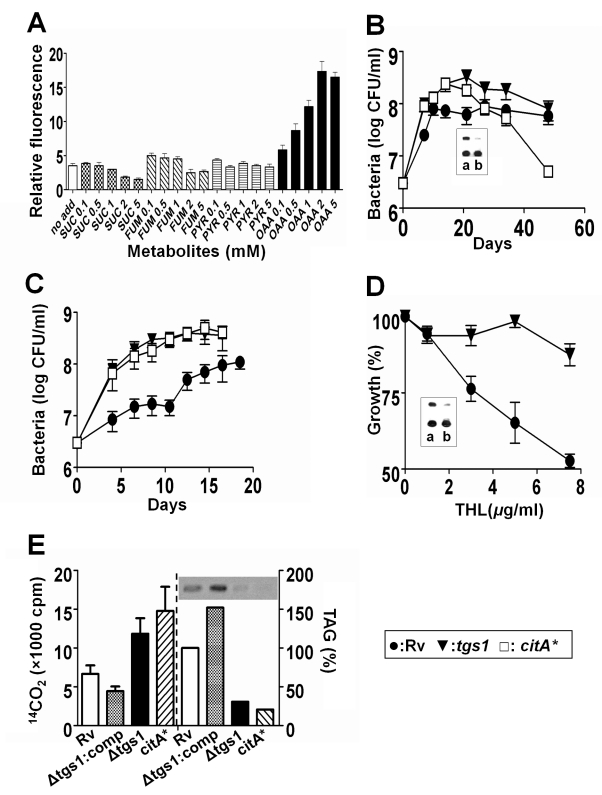
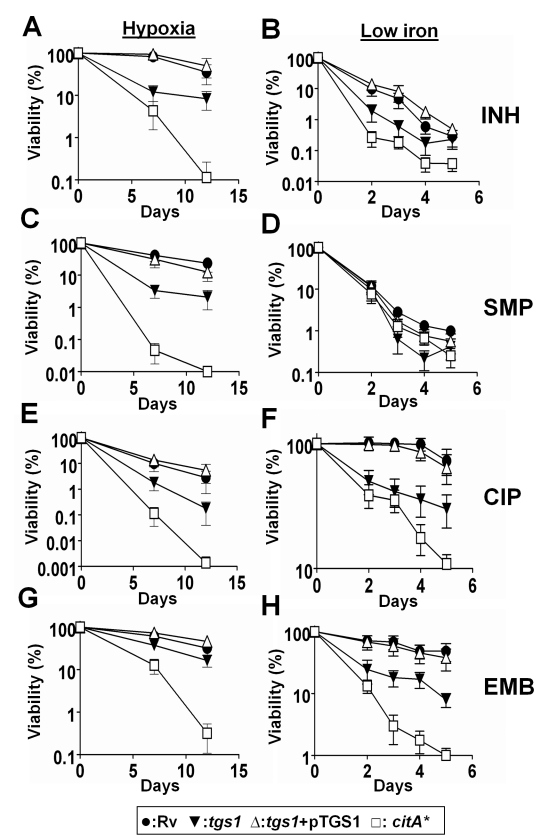
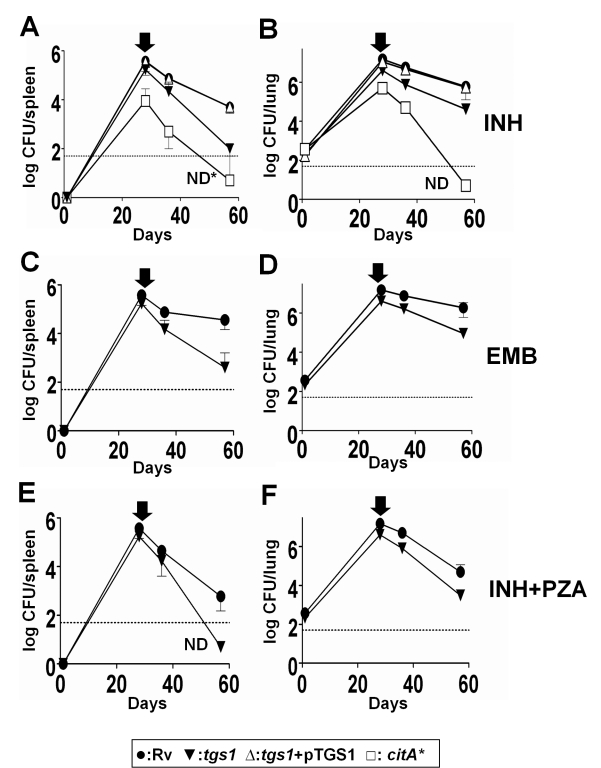
Treatment of chronic bacterial infections, such as tuberculosis (TB), requires a remarkably long course of therapy, despite the availability of drugs that are rapidly bacteriocidal in vitro. This observation has long been attributed to the presence of bacterial populations in the host that are "drug-tolerant" because of their slow replication and low rate of metabolism. However, both the physiologic state of these hypothetical drug-tolerant populations and the bacterial pathways that regulate growth and metabolism in vivo remain obscure. Here we demonstrate that diverse growth-limiting stresses trigger a common signal transduction pathway in Mycobacterium tuberculosis that leads to the induction of triglyceride synthesis. This pathway plays a causal role in reducing growth and antibiotic efficacy by redirecting cellular carbon fluxes away from the tricarboxylic acid cycle. Mutants in which this metabolic switch is disrupted are unable to arrest their growth in response to stress and remain sensitive to antibiotics during infection. Thus, this regulatory pathway contributes to antibiotic tolerance in vivo, and its modulation may represent a novel strategy for accelerating TB treatment.
Conflict of interest statement
The authors have declared that no competing interests exist.
Figures
Comment in
-
Playing TAG with a bacterial stress response.PLoS Biol. 2011 May;9(5):e1001068. doi: 10.1371/journal.pbio.1001068. Epub 2011 May 24. PLoS Biol. 2011. PMID: 21629733 Free PMC article. No abstract available.
Similar articles
-
Playing TAG with a bacterial stress response.PLoS Biol. 2011 May;9(5):e1001068. doi: 10.1371/journal.pbio.1001068. Epub 2011 May 24. PLoS Biol. 2011. PMID: 21629733 Free PMC article. No abstract available.
-
Mycobacterium tuberculosis persistence mutants identified by screening in isoniazid-treated mice.Proc Natl Acad Sci U S A. 2010 Jul 6;107(27):12275-80. doi: 10.1073/pnas.1003219107. Epub 2010 Jun 21. Proc Natl Acad Sci U S A. 2010. PMID: 20566858 Free PMC article.
-
Assessment of treatment response by colony forming units, time to culture positivity and the molecular bacterial load assay compared in a mouse tuberculosis model.Tuberculosis (Edinb). 2017 Jul;105:113-118. doi: 10.1016/j.tube.2017.05.002. Epub 2017 May 8. Tuberculosis (Edinb). 2017. PMID: 28610782
-
[Molecular mechanisms of dormancy and drug tolerance in mycobacteria].Nihon Hansenbyo Gakkai Zasshi. 2013 Dec;82(3):119-22. doi: 10.5025/hansen.82.119. Nihon Hansenbyo Gakkai Zasshi. 2013. PMID: 24579459 Review. Japanese.
-
Tuberculosis Drug Development: History and Evolution of the Mechanism-Based Paradigm.Cold Spring Harb Perspect Med. 2015 Apr 15;5(8):a021147. doi: 10.1101/cshperspect.a021147. Cold Spring Harb Perspect Med. 2015. PMID: 25877396 Free PMC article. Review.
Cited by
-
Tolerance and Persistence to Drugs: A Main Challenge in the Fight Against Mycobacterium tuberculosis.Front Microbiol. 2020 Aug 26;11:1924. doi: 10.3389/fmicb.2020.01924. eCollection 2020. Front Microbiol. 2020. PMID: 32983003 Free PMC article. Review.
-
Gallein and isoniazid act synergistically to attenuate Mycobacterium tuberculosis growth in human macrophages.bioRxiv [Preprint]. 2024 Jan 10:2024.01.10.574965. doi: 10.1101/2024.01.10.574965. bioRxiv. 2024. PMID: 38260681 Free PMC article. Preprint.
-
The bacillary and macrophage response to hypoxia in tuberculosis and the consequences for T cell antigen recognition.Microbes Infect. 2017 Mar;19(3):177-192. doi: 10.1016/j.micinf.2016.10.001. Epub 2016 Oct 22. Microbes Infect. 2017. PMID: 27780773 Free PMC article. Review.
-
Membrane Proteins as a Regulator for Antibiotic Persistence in Gram-Negative Bacteria.J Microbiol. 2023 Mar;61(3):331-341. doi: 10.1007/s12275-023-00024-w. Epub 2023 Feb 17. J Microbiol. 2023. PMID: 36800168 Review.
-
A Feedback Regulatory Loop Containing McdR and WhiB2 Controls Cell Division and DNA Repair in Mycobacteria.mBio. 2022 Apr 26;13(2):e0334321. doi: 10.1128/mbio.03343-21. Epub 2022 Mar 31. mBio. 2022. PMID: 35357209 Free PMC article.
References
-
- World Health Organization. Geneva, Switzerland; 2005. Global tuberculosis control: surveillance, planning, financing.
-
- Salomon J. A, Lloyd-Smith J. O, Getz W. M, Resch S, Sanchez M. S, et al. Prospects for advancing tuberculosis control efforts through novel therapies. PLoS Med. 2006;3:e273. doi: 10.1371/journal.pmed.0030273. - DOI - PMC - PubMed
-
- Gomez J. E, McKinney J. D. M. tuberculosis persistence, latency, and drug tolerance. Tuberculosis (Edinb) 2004;84:29–44. - PubMed
-
- Rohde K, Yates R. M, Purdy G. E, Russell D. G. Mycobacterium tuberculosis and the environment within the phagosome. Immunol Rev. 2007;219:37–54. - PubMed
Publication types
MeSH terms
Substances
Grants and funding
LinkOut - more resources
Full Text Sources
Other Literature Sources
Medical
