

In vitro evolution of ligands to the membrane protein caveolin
- PMID: 21615158
- PMCID: PMC3120933
- DOI: 10.1021/ja201792q
In vitro evolution of ligands to the membrane protein caveolin
Abstract
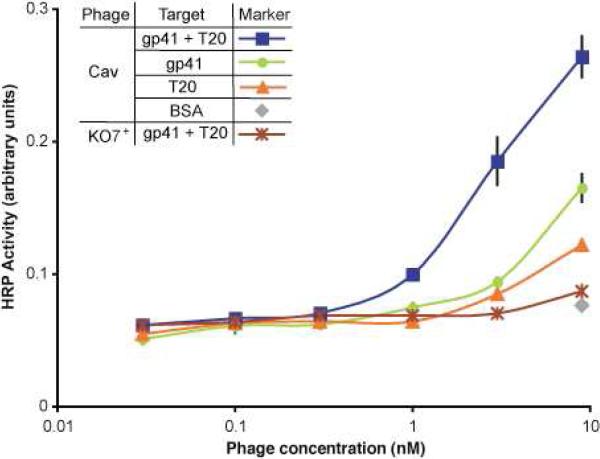
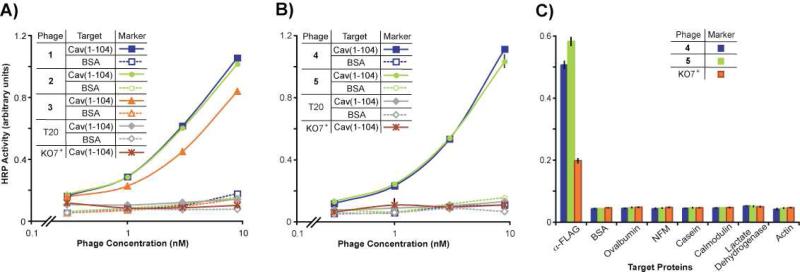
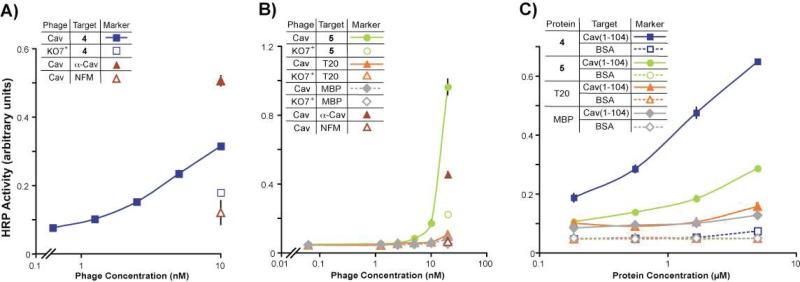
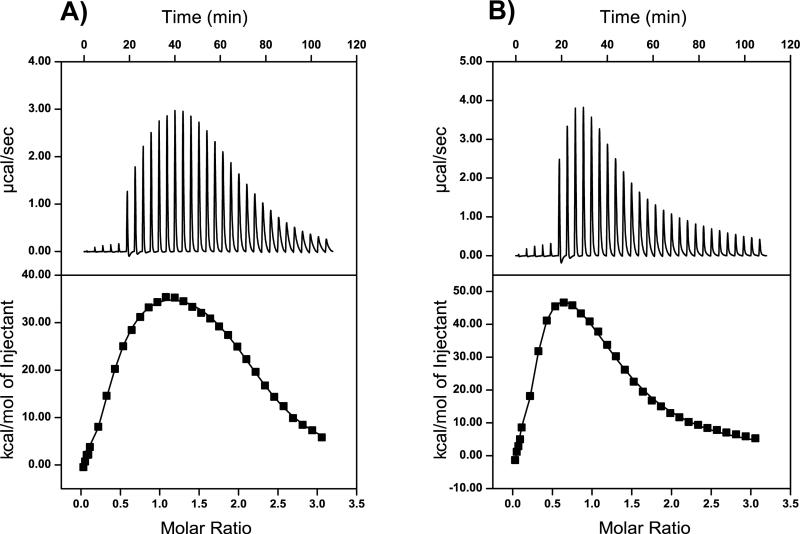
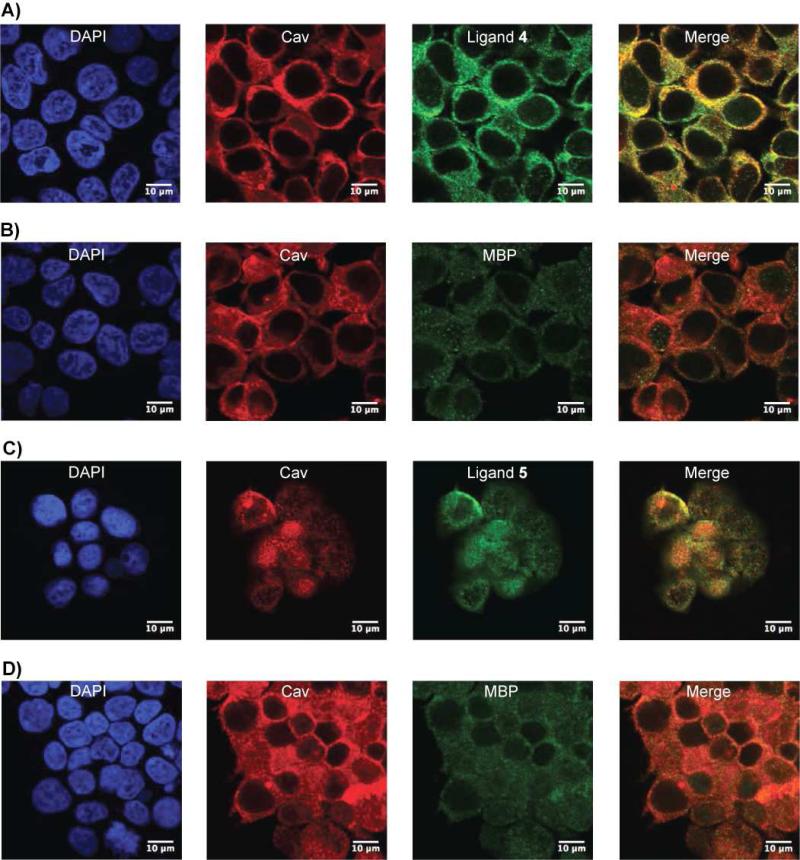
Membrane proteins comprise a third of the human genome, yet present challenging targets for reverse chemical genetics. For example, although implicated in numerous diseases including multiple myeloma, the membrane protein caveolin-1 appears to offer a poor target for the discovery of synthetic ligands due to its largely unknown structure and insolubility. To break this impasse and identify new classes of caveolae controlling lead compounds, we applied phage-based, reverse chemical genetics for the discovery of caveolin-1 ligands derived from the anti-HIV therapeutic T20. Substitution of homologous residues into the T20 sequence used a process analogous to medicinal chemistry for the affinity maturation to bind caveolin. The resultant caveolin-1 ligands bound with >1000-fold higher affinity than wild-type T20. Two types of ELISAs and isothermal titration calorimetry (ITC) measurements demonstrated high affinity binding to caveolin by the T20 variants with K(d) values in the 150 nM range. Microscopy experiments with the highest affinity caveolin ligands confirmed colocalization of the ligands with endogenous caveolin in NIH 3T3 cells. The results establish the foundation for targeting caveolin and caveolae formation in living cells.
Figures
Similar articles
-
Interactions of HIV-1 inhibitory peptide T20 with the gp41 N-HR coiled coil.J Biol Chem. 2009 Feb 6;284(6):3619-27. doi: 10.1074/jbc.M809269200. Epub 2008 Dec 10. J Biol Chem. 2009. PMID: 19073602 Free PMC article.
-
Directed evolution and biophysical characterization of a full-length, soluble, human caveolin-1 variant.Biochim Biophys Acta Proteins Proteom. 2018 Sep;1866(9):963-972. doi: 10.1016/j.bbapap.2018.05.014. Epub 2018 May 29. Biochim Biophys Acta Proteins Proteom. 2018. PMID: 29857161 Free PMC article.
-
The C4 region as a target for HIV entry inhibitors--NMR mapping of the interacting segments of T20 and gp120.FEBS J. 2015 Dec;282(24):4643-57. doi: 10.1111/febs.13541. Epub 2015 Oct 22. FEBS J. 2015. PMID: 26432362 Free PMC article.
-
Biochemistry and biophysics of HIV-1 gp41 - membrane interactions and implications for HIV-1 envelope protein mediated viral-cell fusion and fusion inhibitor design.Curr Top Med Chem. 2011 Dec;11(24):2959-84. doi: 10.2174/156802611798808497. Curr Top Med Chem. 2011. PMID: 22044229 Free PMC article. Review.
-
[The current progress in the development of HIV-1 fusion inhibitors].Yao Xue Xue Bao. 2010 Feb;45(2):184-93. Yao Xue Xue Bao. 2010. PMID: 21351428 Review. Chinese.
Cited by
-
Affinity-Guided Design of Caveolin-1 Ligands for Deoligomerization.J Med Chem. 2016 Apr 28;59(8):4019-25. doi: 10.1021/acs.jmedchem.5b01536. Epub 2016 Apr 11. J Med Chem. 2016. PMID: 27010220 Free PMC article.
-
Dissecting binding of a β-barrel membrane protein by phage display.Mol Biosyst. 2017 Jul 25;13(8):1438-1447. doi: 10.1039/c7mb00163k. Mol Biosyst. 2017. PMID: 28627567 Free PMC article.
-
Shear-stress-mediated refolding of proteins from aggregates and inclusion bodies.Chembiochem. 2015 Feb 9;16(3):393-6. doi: 10.1002/cbic.201402427. Epub 2015 Jan 23. Chembiochem. 2015. PMID: 25620679 Free PMC article.
-
The scope of phage display for membrane proteins.J Mol Biol. 2011 Dec 9;414(4):499-510. doi: 10.1016/j.jmb.2011.10.021. Epub 2011 Oct 20. J Mol Biol. 2011. PMID: 22037583 Free PMC article.
-
Enzyme-Regulated Supramolecular Assemblies of Cholesterol Conjugates against Drug-Resistant Ovarian Cancer Cells.J Am Chem Soc. 2016 Aug 31;138(34):10758-61. doi: 10.1021/jacs.6b06075. Epub 2016 Aug 18. J Am Chem Soc. 2016. PMID: 27529637 Free PMC article.
References
-
- Russell RB, Eggleston DS. Nat. Struct. Biol. 2000;(Suppl):7, 928–930. - PubMed
-
- White SH. Nature. 2009;459:344–346. - PubMed
-
- Murata M, Peranen J, Schreiner R, Wieland F, Kurzchalia TV, Simons K. Proc. Natl. Acad. Sci. U. S. A. 1995;92:10339–10343. - PMC - PubMed
- Hill MM, Bastiani M, Luetterforst R, Kirkham M, Kirkham A, Nixon SJ, Walser P, Abankwa D, Oorschot VM, Martin S, Hancock JF, Parton RG. Cell. 2008;132:113–124. - PMC - PubMed
- Hansen CG, Bright NA, Howard G, Nichols BJ. Nat. Cell Biol. 2009;11:807–814. - PMC - PubMed
- Stahlhut M, van Deurs B. Mol. Biol. Cell. 2000;11:325–337. - PMC - PubMed
Publication types
MeSH terms
Substances
Grants and funding
LinkOut - more resources
Full Text Sources
Other Literature Sources
