. 2011 Jul 1;187(1):337-49.
doi: 10.4049/jimmunol.1003525. Epub 2011 May 25.

Identification of Cd101 as a susceptibility gene for Novosphingobium aromaticivorans-induced liver autoimmunity

Affiliations

Identification of Cd101 as a susceptibility gene for Novosphingobium aromaticivorans-induced liver autoimmunity

Javid P Mohammed et al. J Immunol. .

Abstract

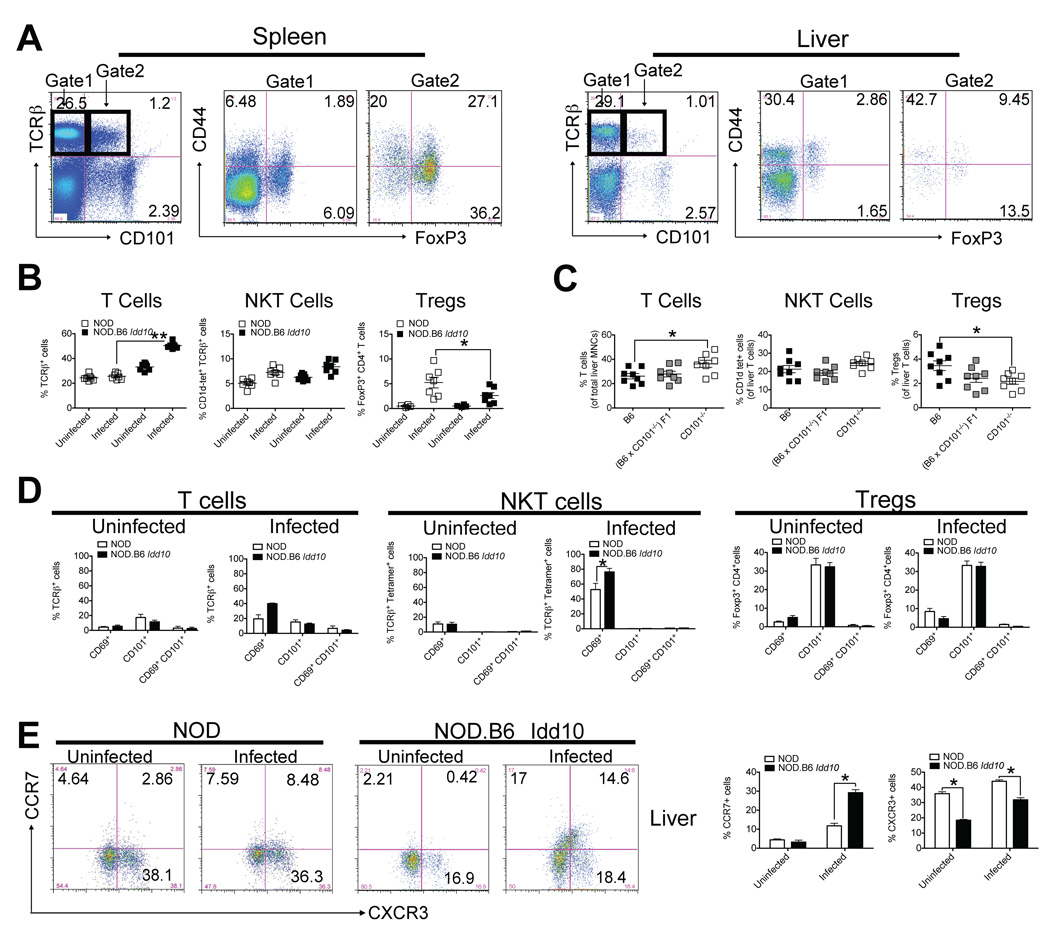
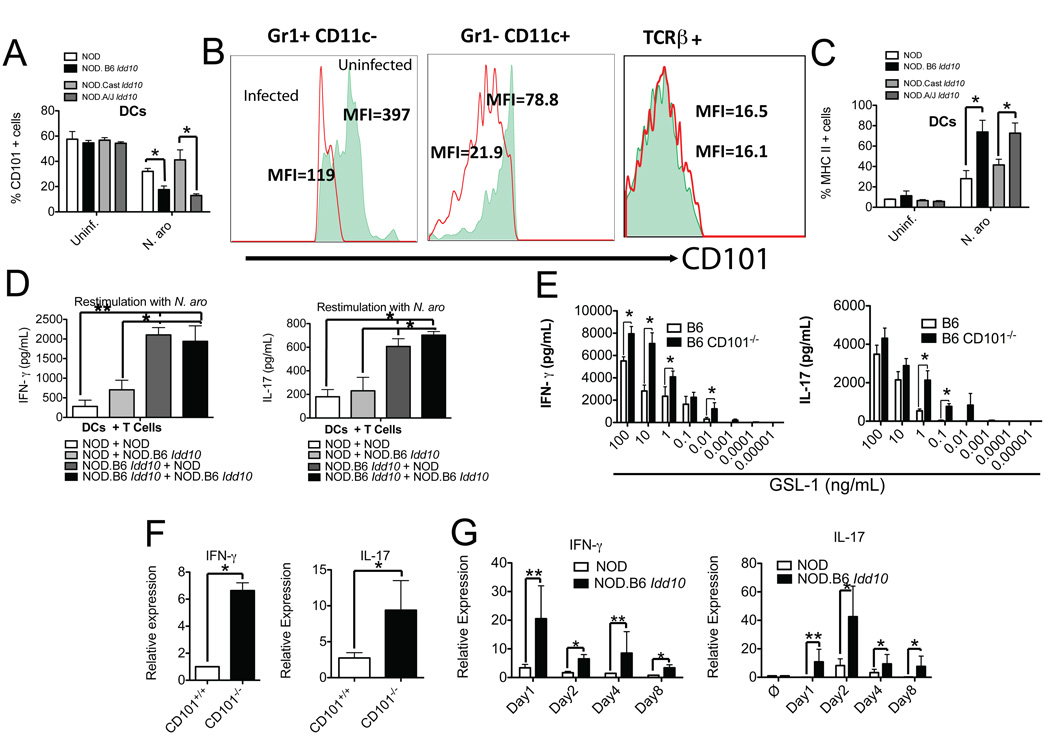
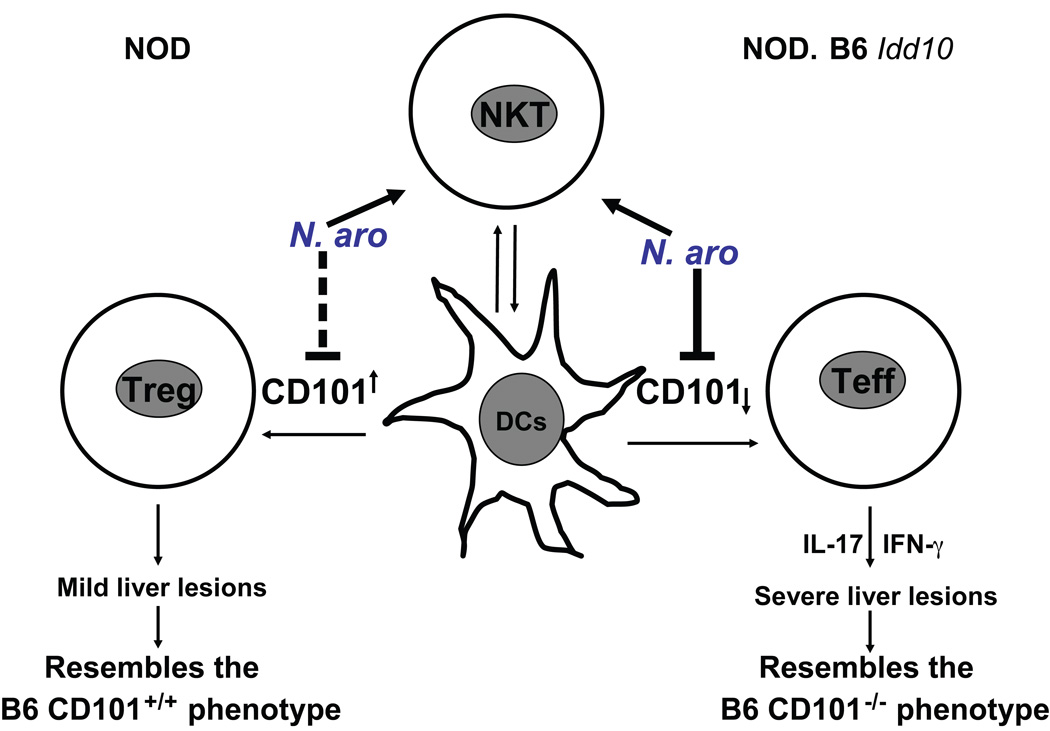
Environmental and genetic factors define the susceptibility of an individual to autoimmune disease. Although common genetic pathways affect general immunological tolerance mechanisms in autoimmunity, the effects of such genes could vary under distinct immune challenges within different tissues. In this study, we demonstrate this by observing that autoimmune type 1 diabetes-protective haplotypes at the insulin-dependent diabetes susceptibility region 10 (Idd10) introgressed from chromosome 3 of C57BL/6 (B6) and A/J mice onto the NOD background increase the severity of autoimmune primary biliary cirrhosis induced by infection with Novosphingobium aromaticivorans, a ubiquitous alphaproteobacterium, when compared with mice having the NOD and NOD.CAST Idd10 type 1 diabetes-susceptible haplotypes. Substantially increased liver pathology in mice having the B6 and A/J Idd10 haplotypes correlates with reduced expression of CD101 on dendritic cells, macrophages, and granulocytes following infection, delayed clearance of N. aromaticivorans, and the promotion of overzealous IFN-γ- and IL-17-dominated T cell responses essential for the adoptive transfer of liver lesions. CD101-knockout mice generated on the B6 background also exhibit substantially more severe N. aromaticivorans-induced liver disease correlating with increased IFN-γ and IL-17 responses compared with wild-type mice. These data strongly support the hypothesis that allelic variation of the Cd101 gene, located in the Idd10 region, alters the severity of liver autoimmunity induced by N. aromaticivorans.


Figures

Figure 1
Figure 1. Cd101 is the major PBC-susceptibility gene within the Idd10/18 region
(A) The B6 allele at the Idd10 region is sufficient for severe liver disease. 5 week-old female B6, NOD, NOD.B6 Idd10/18, NOD.B6 Idd10 and NOD.B6 Idd18 mice were infected intravenously with 5×10⁷ N. aro cfus. H&E stained liver sections of the indicated mouse strains were analyzed at week 19 after infection for the severity of portal inflammation in blinded studies. Statistical significance was calculated using a Mann-Whitney test (a rank test) for the median score of five liver sections from 10 individual mice per strain and indicated as * for p<0.05. Data of two independent experiments were combined and respective pictures for the determination of inflammation in NOD and NOD.B6 Idd10 mice are displayed in Fig. S2. (B) Infection does not reverse the protection from T1D in NOD.B6 Idd10 mice. Blood glucose levels in infected and age- and sex-matched uninfected female NOD.B6 Idd10 mice were determined every other week and analyzed until 200 days after infection. Mice with blood glucose levels > 300 mg/mL were considered diabetic and the pancreas was harvested for the analysis of insulitis after reconfirmation of blood glucose levels > 500 mg/mL. Statistical significance was calculated using a survival curve analysis for 19 mice in the uninfected control group and 30 infected mice (p=0.1225). (C) NOD.A/J Idd10 mice containing the B6 Cd101 haplotype develop similar severe liver disease as NOD.B6 Idd10 mice. Liver sections of the indicated mouse strains were analyzed in blinded studies for the severity of portal inflammation. Statistical significance was calculated using a Mann-Whitney test for 8 individual mice 4 months after infection and indicated as * for p<0.05. (D) Genetic deletion of CD101 enhances the severity of liver lesions in B6 mice upon infection with N. aro. Histopathological scores for portal inflammation two months after infection were determined in blinded studies. Statistical significance was calculated using a Mann-Whitney test for eight individual mice in each group and indicated as * for p<0.05 and ** for p<0.01. The experiments were repeated twice with similar results. (E) Increased numbers of N. aro in the livers of NOD.B6 Idd10 mice. Bacterial burden in different organs from individual NOD and NOD.B6 Idd10 mice on day two post-infection (each bar represents mean ± standard deviation of three individual mice per strain) was assessed by cfu plating assays and limiting dilution. One experiment representative of three is shown. Statistical significance was calculated using a student’s t-test and indicated as * for p<0.05 comparing bacterial load in the livers of NOD.B6 Idd10 and NOD mice. (F) Prolonged bacterial persistence in mice containing the B6 CD101 allele. Copy numbers of N. aro in individual livers of the indicated mouse strains were analyzed by a N. aro-specific 16S rRNA qPCR. N. aro copies in the livers of NOD.B6 Idd10 and NOD.B6 Idd10/Idd18 mice were compared to parental NOD mice and analyzed at weeks 7 (left panel) and 9 (right panel) after infection. Statistical significance for two combined independent experiments was calculated with organs from 3 individual mice for each strain using a student’s t-test and indicated as * for p<0.05.
Figure 2
Figure 2. N. aro induces an overzealous T cell response in the liver without modulating the expression of CD101 on T cells
(A) CD101-expressing T cells in the livers are mainly CD44 positive, while CD101-expressing T cells in the spleen preferentially express FoxP3. Representative FACS dot plots for the expression of CD101 in spleen and liver of uninfected 6 week-old NOD.B6 Idd10 mice are shown. Cells were distinguished within CD101+ and CD101− T cells and the percentage of CD44+ and FoxP3+ populations in spleen and liver are displayed. Note that the majority of CD101 expressing immune cells in the liver are not T cells. (B+C) N. aro-infection increases total T cell percentages in the livers of NOD.B6 Idd10 (B) and B6 CD101−/− (C) mice, while Tregs preferentially accumulate in the livers of infected parental NOD (B) and B6 (C) mice T, NKT and Treg percentages in uninfected and infected 5 week-old NOD and NOD.B6 Idd10 mice (B) as well as in infected B6 CD101+/+, B6 CD101+/− and B6 CD101−/− (B) mice representative of 7 (B) and 8 (C) individual mice each were determined at day 18 after infection. Statistical significance was calculated using a student’s t-test and indicated as * for p<0.05 and as ** for p<0.01. Note that there are very few Tregs in the livers of uninfected mice. (D) Infection of mice does not alter CD101 expression levels and distribution on liver T lymphocytes A representative summary of CD69 and/or CD101 expression by T cells (gated on TCRβ+) (left two panels), NKT cells (gated on TCRβ+ CD1d-tetramer+) (middle two panels) and Tregs (gated on TCRβ+ CD4+ FoxP3+) (right two panels) for 8 individual mice at day 1 after infection is shown. Statistical significance was calculated using a student’s t-test and indicated as * for p<0.05. (E) NOD.B6 Idd10 mice recruit enhanced numbers of CCR7-expressing T cells specifically to the liver upon N. aro-infection. Representative FACS dot plots for CCR7- and CXCR3- expression by T cells (gated on TCRβ+) for 8 individual mice are displayed at day 24 after infection. Data for 8 individual mice are summarized in the bar graphs on the right. Statistical significance was determined using a student’s t-test and indicated as * for p<0.05.
Figure 3
Figure 3. MHC class I and II-restricted TCRα/β+ T cells secreting IFN-γ and IL-17, but not γ/δ T cells or NK cells, are required for the adoptive transfer of liver lesions
Transfer of 1×10⁷ purified TCRβ+ T cells (A), TCRγ/δ+ or NKp46+ cells (B) from spleens and livers of 12 individual N. aro-infected B6 (A) or NOD.B6 Idd10 (B) mice into the indicated, irradiated 12 week-old recipient mice (cells from two individual mice are combined for the adoptive transfer into one recipient each). Livers from recipient mice were harvested 6 weeks after the adoptive transfer and the severity of liver lesions was scored in blinded studies. Recipients and donors were N. aro-free as determined by a N. aro-specific 16S rRNA qPCR. Results of two independent experiments (A+B) have been combined and statistical significance of the differences in histopathological scores was calculated using a Mann-Whitney test for 6 individual recipients per strain and indicated as * for p<0.05 and as ** for p<0.01.
Figure 4
Figure 4. Infection of mice with N. aro selectively suppresses the expression of CD101 on APCs and phagocytes
(A–C) Enhanced downregulation of CD101 expression on liver cells from NOD.B6 Idd10 mice upon infection with N. aro. Representative FACS plots for the percentages and mean fluorescence intensities (MFIs) of Gr1+ (A), CD11c+ (B) and F4/80+ cells (C) obtained from the livers of naïve and infected (five days after infection) NOD.B6 Idd10 mice are displayed. Data describing the number of CD101+ Gr1+ (A), CD101+ CD11c+ (B) and CD101+ F4/80+ cells (C) in NOD, NOD.B6 Idd10 and B6 mice from two independent experiments were summarized in the right panels. Statistical significance was calculated using a student’s t-test and indicated as * for p<0.05. Note the increased accumulation of all three cell populations upon infection. (D) Enhanced recruitment of DCs, but reduced accumulation of granulocytes in the livers of infected NOD.B6 Idd10 and CD101-deficient B6 compared to parental NOD and B6 mice. Mice (n=6) were infected with N. aro five days prior to analysis by flow cytometry and the granulocyte and DC percentages in their livers were compared to age- and sex matched control mice. Each dot represents the percentage of granulocytes (Gr1+) and DCs (CD11c+) in the liver of an individual mouse. Statistical significance was calculated using a student’s t-test and indicated as * for p<0.05. (E+F) Persistent N. aro-infection correlates with increased CCL21 expression in the liver. CCL21 mRNA copies were analyzed in 5×10⁶ liver lymphocytes (E) and splenocytes (F) from infected mice at week 4 after infection by qPCR. HGPRT mRNA copies were used to normalize expression levels and the quotient of the respective cytokine over the HGPRT copies was calculated. The quotient cytokine/HGPRT was set as 1 for the liver of naïve, uninfected NOD mice. Spleen cells from uninfected NOD mice have a quotient of 0.53, while liver and spleen cells from uninfected NOD.B6 Idd10 mice have a quotient of 1.18 and 0.41, respectively. The relative increase of CCL21 copy numbers in infected NOD and NOD.B6 Idd10 is displayed. Mean and standard deviation of four individual mice were compared. Statistical significance was calculated using a student’s t-test and indicated as * for p<0.05.
Figure 5
Figure 5. Background specific regulation of DC and granulocyte recruitment and activation upon infection
(A–D) The influx of granulocytes and DCs in the livers of infected, mixed bone marrow chimeras is background-intrinsic. Irradiated NOD.B6 Ptprc CD45.2+ mice were reconstituted with a 1:1 mixture of NOD.B6 Idd10 (CD45.1+) and CD45.2+ NOD.B6 Ptprc bone marrow cells (A+C). Similarly, irradiated B6 CD45.1+ mice were reconstituted with a 1:1 mixture of B6 CD101−/− (CD45.2+) and CD45.1+ B6 bone marrow cells (B+D). Bone marrow chimeras were infected 6 weeks after bone marrow reconstitution with N. aro. At day 1 (not shown) and day 8, percentages of granulocytes (A+B) and DCs (C+D) into infected and inflamed livers was assessed using CD45.1 allotype-specific antibodies to assign their origin to parental NOD and B6 or congenic NOD.B6 Idd10 and CD101-deficient B6 mice. Statistical significance was calculated using a Linear-Mixed-Effect Model for eight (A+C) and six (B+D) individual naïve and infected chimeric mice and indicated as * for p < 0.05. The summary of data as well as the representative FACS dot plots for infected and uninfected control mice are displayed. Similar results were obtained using reciprocal bone marrow chimeras (data not shown). (E+F) DCs from NOD.B6 Idd10 and CD101-deficient B6 mice express higher levels of MHC II compared to parental NOD and B6 mice. CD11c+ DCs were analyzed for their CD101 and MHC II expression. The origin of CD11c+ cells was distinguished by gating on CD45.1+ and CD45.2+ cells in the respective bone marrow chimeras as described above. Representative FACS dot plots are displayed for day 2 after infection for cells of NOD and NOD.B6 Idd10 (E) origin. Data for six individual NOD.B6 Ptprc CD45.2/NOD.B6 Idd10 (E) and six individual B6 CD45.1/ CD101−/− (F) bone marrow chimeras are summarized in the respective bar graphs. Statistical significance was calculated using a student’s t-test and indicated as * for p<0.05.
Figure 6
Figure 6. Expression of the B6 Cd101 allele enhances IFN-γ and IL-17 responses and defines the severity of liver disease
(A–E) Allele dependent suppression of CD101 on DCs enhances IFN-γ- and IL-17-release by T cells. (A–C) Suppression of CD101 expression and enhancement of MHC II expression after in vitro exposure to N. aro. Bone marrow-derived DCs (after seven days of in vitro culture) from the indicated mouse strains (A+C) or liver mononuclear cells from 3 individual NOD.B6 Idd10 mice depleted of B and NK cells using MACS (B) were exposed to N. aro at a ratio of 1:50 (A+C) or 1:10 (B) or remained uninfected. 48 hours later, infected and uninfected DCs (A+C) as well as Gr1+, CD11c+ and TCRβ+ cells (B) were analyzed for CD101 (A+B) and MHC II (C) expression. The summary of four independent experiments is displayed (A+C). Statistical significance was calculated using a student’s t-test and indicated as * for p<0.05. Note that the suppression of CD101 protein expression on DCs containing the B6 Cd101 allele is enhanced (A) and the CD101 expression on both Gr1+ and CD11c+ cells is reduced upon infection while CD101 expression on T cells remains unaffected (B). The MFIs for CD101 expression in uninfected cells are represented by the filled areas in the histograms, while infected cells are represented by the red line (B). (D) N. aro stimulated IFN-γ and IL-17 release by T cells is augmented by the B6.Idd10 allele in a DC intrinsic manner Bone marrow-derived DCs from NOD and NOD.B6 Idd10 mice were pulsed with N. aro. at a ratio N. aro to APCs of 50:1 and co-cultured with liver lymphocytes from infected NOD and NOD.B6 Idd10 mice. Cell culture supernatants were assayed 72 hours later for the release of IFN-γ (left panel) and IL-17 (right panel) by ELISA. Results of two independent experiments with cells from 6 mice in total were combined and statistical significance calculated using a student’s t-test and indicated as * for p<0.05 and as ** for p<0.01. (E) CD101-deficiency enhances IFN-γ and IL-17 release from T cells Bone marrow-derived DCs from CD101-deficient and wild type B6 mice were pulsed with the indicated N. aro GSL-1 concentrations and incubated with liver T cells from uninfected mice. Cell culture supernatants were assayed 72 hours later for the release of IFN-γ (left panel) and IL-17 (right panel) by ELISA. Results of two independent experiments with cells from 6 mice in total were combined and statistical significance calculated using a student’s t-test and indicated as * for p<0.05. (F+G) The induction of IFN-γ and IL-17 responses upon N. aro-infection is a consequence of CD101 suppression. Expression of mRNA copies for IFN-γ and IL-17 was analyzed in 5×10⁶ liver lymphocytes each from infected B6 wild type and CD101-deficient mice 19 days after infection (F) and in a kinetic experiment comparing NOD and NOD.B6 Idd10 mice (G) by qPCR. The relative increase in cytokine copy numbers of CD101-deficient and NOD.B6 Idd10 over parental B6 and NOD mice is displayed. Mean and standard deviation for cytokine copies of four individual mice were compared and statistical significance was determined using a student’s t-test and indicated as * for p<0.05 and as ** for p<0.01.
Figure 7
Figure 7. Cd101 alleles regulate the resistance and susceptibility to liver disease induced by N. aro-infection
Expression of the NOD Cd101 allele induces a more tolerogenic milieu in the liver by promoting Treg responses whereas expression of the B6 Cd101 allele triggers an overzealous T cell response upon infection with N. aro. The loss of CD101 expression on DCs drives the enhanced IFN-γ and IL-17 production by T cells and subsequently the induction of liver disease upon N. aro-infection.

Similar articles

Cited by

References

    1. Rioux JD, Abbas AK. Paths to understanding the genetic basis of autoimmune disease. Nature. 2005;435:584–589. - PubMed
    1. Bjorses P, Aaltonen J, Horelli-Kuitunen N, Yaspo ML, Peltonen L. Gene defect behind APECED: a new clue to autoimmunity. Hum. Mol. Genet. 1998;7:1547–1553. - PubMed
    1. Walker LS, Abbas AK. The enemy within: keeping self-reactive T cells at bay in the periphery. Nat. Rev Immunol. 2002;2:11–19. - PubMed
    1. He XS, Ansari AA, Ridgway WM, Coppel RL, Gershwin ME. New insights to the immunopathology and autoimmune responses in primary biliary cirrhosis. Cell Immunol. 2006;239:1–13. - PubMed
    1. Alonso A, Sasin J, Bottini N, Friedberg I, Friedberg I, Osterman A, Godzik A, Hunter T, Dixon J, Mustelin T. Protein tyrosine phosphatases in the human genome. Cell. 2004;117:699–711. - PubMed

Publication types

MeSH terms