

Loss of AS160 Akt substrate causes Glut4 protein to accumulate in compartments that are primed for fusion in basal adipocytes
- PMID: 21613213
- PMCID: PMC3143591
- DOI: 10.1074/jbc.M111.253880
Loss of AS160 Akt substrate causes Glut4 protein to accumulate in compartments that are primed for fusion in basal adipocytes
Abstract
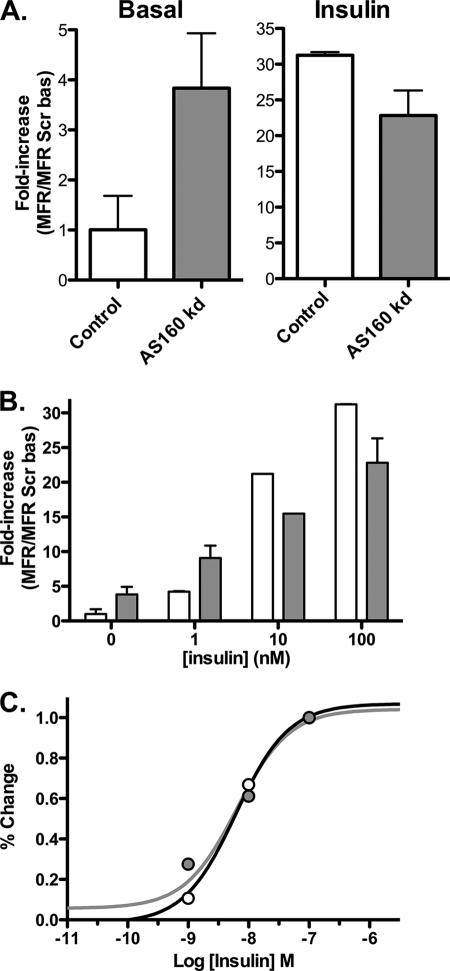
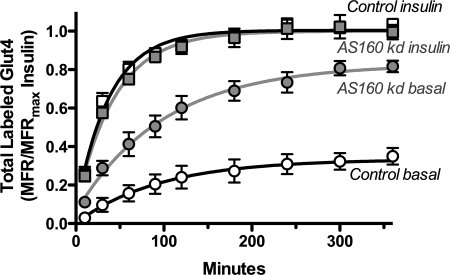
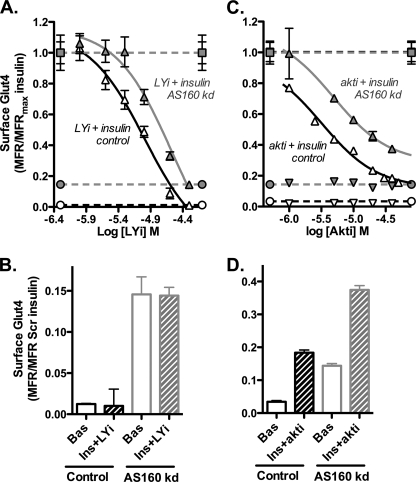
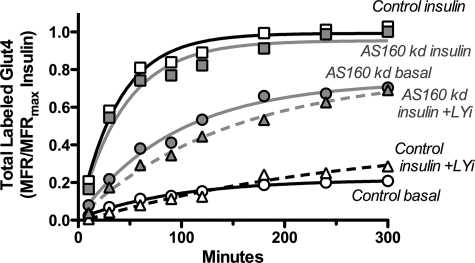
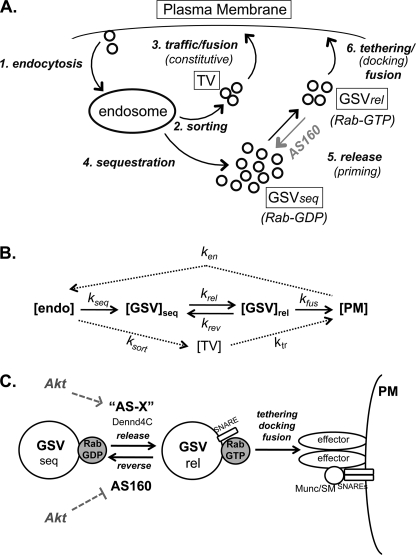
The Akt substrate AS160 (TCB1D4) regulates Glut4 exocytosis; shRNA knockdown of AS160 increases surface Glut4 in basal adipocytes. AS160 knockdown is only partially insulin-mimetic; insulin further stimulates Glut4 translocation in these cells. Insulin regulates translocation as follows: 1) by releasing Glut4 from retention in a slowly cycling/noncycling storage pool, increasing the actively cycling Glut4 pool, and 2) by increasing the intrinsic rate constant for exocytosis of the actively cycling pool (k(ex)). Kinetic studies were performed in 3T3-L1 adipocytes to measure the effects of AS160 knockdown on the rate constants of exocytosis (k(ex)), endocytosis (k(en)), and release from retention into the cycling pool. AS160 knockdown released Glut4 into the actively cycling pool without affecting k(ex) or k(en). Insulin increased k(ex) in the knockdown cells, further increasing cell surface Glut4. Inhibition of phosphatidylinositol 3-kinase or Akt affected both k(ex) and release from retention in control cells but only k(ex) in AS160 knockdown cells. Glut4 vesicles accumulate in a primed pre-fusion pool in basal AS160 knockdown cells. Akt regulates the rate of exocytosis of the primed vesicles through an AS160-independent mechanism. Therefore, there is an additional Akt substrate that regulates the fusion of Glut4 vesicles that remain to be identified. Mathematical modeling was used to test the hypothesis that this substrate regulates vesicle priming (release from retention), whereas AS160 regulates the reverse step by stimulating GTP turnover of a Rab protein required for vesicle tethering/docking/fusion. Our analysis indicates that fusion of the primed vesicles with the plasma membrane is an additional non-Akt-dependent insulin-regulated step.
Figures


Similar articles
-
Insulin-regulated Glut4 translocation: membrane protein trafficking with six distinctive steps.J Biol Chem. 2014 Jun 20;289(25):17280-98. doi: 10.1074/jbc.M114.555714. Epub 2014 Apr 28. J Biol Chem. 2014. PMID: 24778187 Free PMC article.
-
Characterization of the role of the Rab GTPase-activating protein AS160 in insulin-regulated GLUT4 trafficking.J Biol Chem. 2005 Nov 11;280(45):37803-13. doi: 10.1074/jbc.M503897200. Epub 2005 Sep 8. J Biol Chem. 2005. PMID: 16154996
-
Full intracellular retention of GLUT4 requires AS160 Rab GTPase activating protein.Cell Metab. 2005 Oct;2(4):263-72. doi: 10.1016/j.cmet.2005.09.005. Cell Metab. 2005. PMID: 16213228
-
Glucose transporter 4: cycling, compartments and controversies.EMBO Rep. 2005 Dec;6(12):1137-42. doi: 10.1038/sj.embor.7400584. EMBO Rep. 2005. PMID: 16319959 Free PMC article. Review.
-
Ins (endocytosis) and outs (exocytosis) of GLUT4 trafficking.Curr Opin Cell Biol. 2007 Aug;19(4):466-73. doi: 10.1016/j.ceb.2007.04.018. Epub 2007 Jul 17. Curr Opin Cell Biol. 2007. PMID: 17644329 Free PMC article. Review.
Cited by
-
Dynamic GLUT4 sorting through a syntaxin-6 compartment in muscle cells is derailed by insulin resistance-causing ceramide.Biol Open. 2014 Apr 4;3(5):314-25. doi: 10.1242/bio.20147898. Biol Open. 2014. PMID: 24705014 Free PMC article.
-
AS160 controls eukaryotic cell cycle and proliferation by regulating the CDK inhibitor p21.Cell Cycle. 2016 Jul 2;15(13):1733-41. doi: 10.1080/15384101.2016.1183853. Epub 2016 May 6. Cell Cycle. 2016. PMID: 27152871 Free PMC article.
-
A high-throughput chemical-genetics screen in murine adipocytes identifies insulin-regulatory pathways.J Biol Chem. 2019 Mar 15;294(11):4103-4118. doi: 10.1074/jbc.RA118.006986. Epub 2018 Dec 27. J Biol Chem. 2019. PMID: 30591588 Free PMC article.
-
Normalization of maternal adiponectin in obese pregnant mice prevents programming of impaired glucose metabolism in adult offspring.FASEB J. 2022 Jul;36(7):e22383. doi: 10.1096/fj.202200326R. FASEB J. 2022. PMID: 35670755 Free PMC article.
-
Flow cytometry protocol for GLUT4-myc detection on cell surfaces.Biosci Rep. 2024 Apr 24;44(4):BSR20231987. doi: 10.1042/BSR20231987. Biosci Rep. 2024. PMID: 38533799 Free PMC article.
References
Publication types
MeSH terms
Substances
Grants and funding
LinkOut - more resources
Full Text Sources
Research Materials
