

Deptor knockdown enhances mTOR Activity and protein synthesis in myocytes and ameliorates disuse muscle atrophy
- PMID: 21607293
- PMCID: PMC3188866
- DOI: 10.2119/molmed.2011.00070
Deptor knockdown enhances mTOR Activity and protein synthesis in myocytes and ameliorates disuse muscle atrophy
Abstract
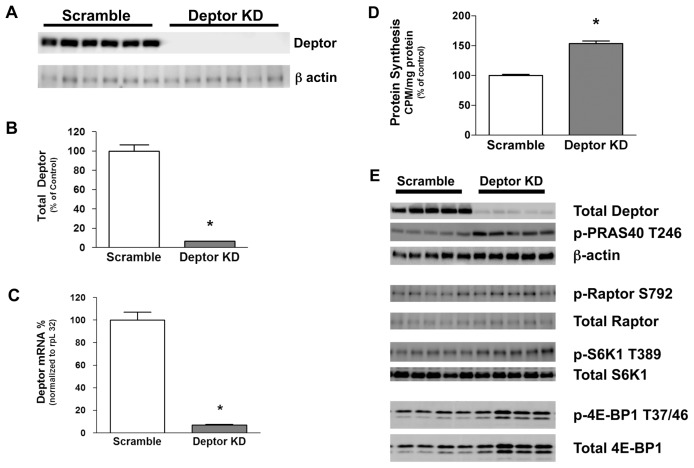
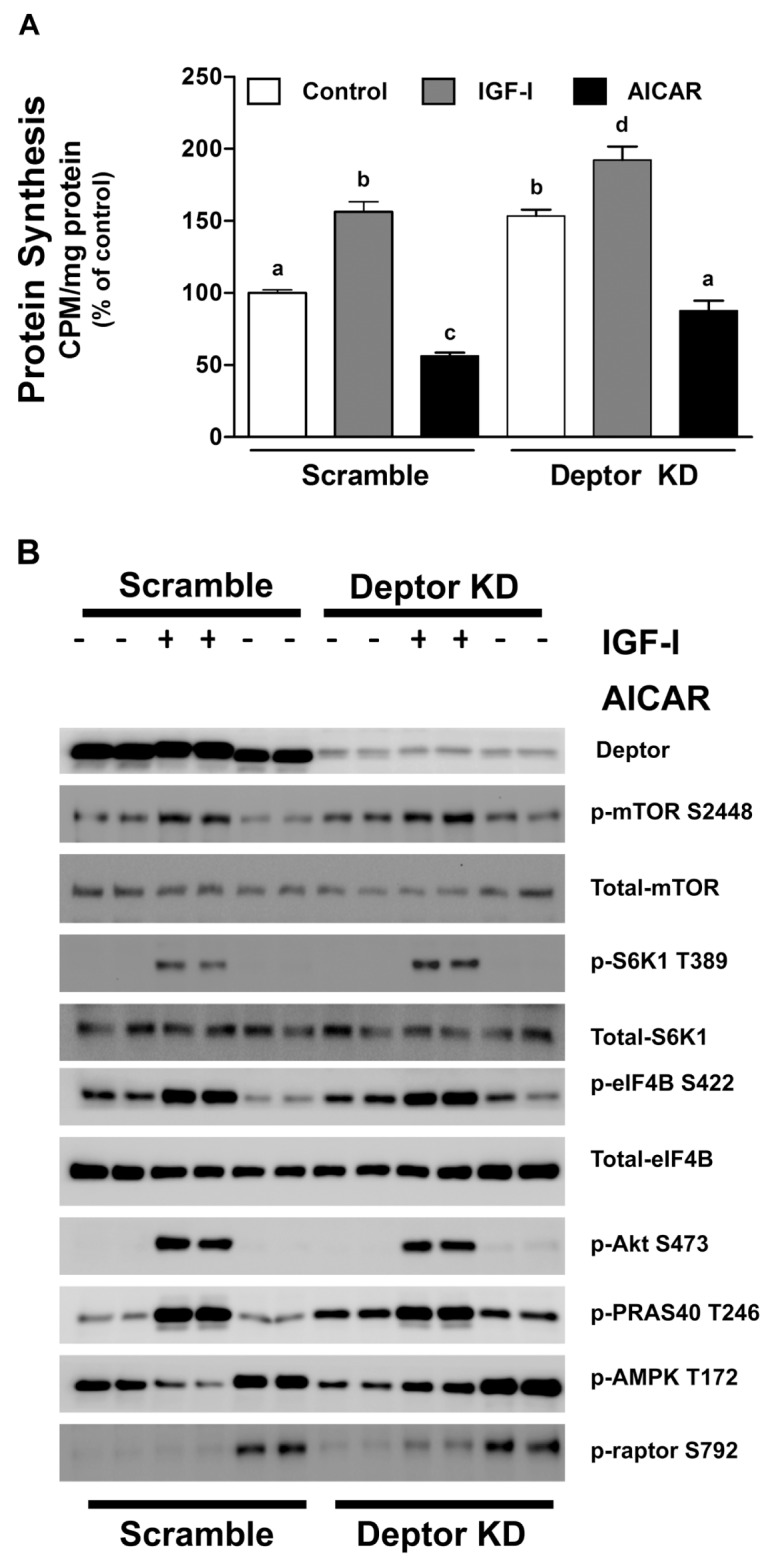
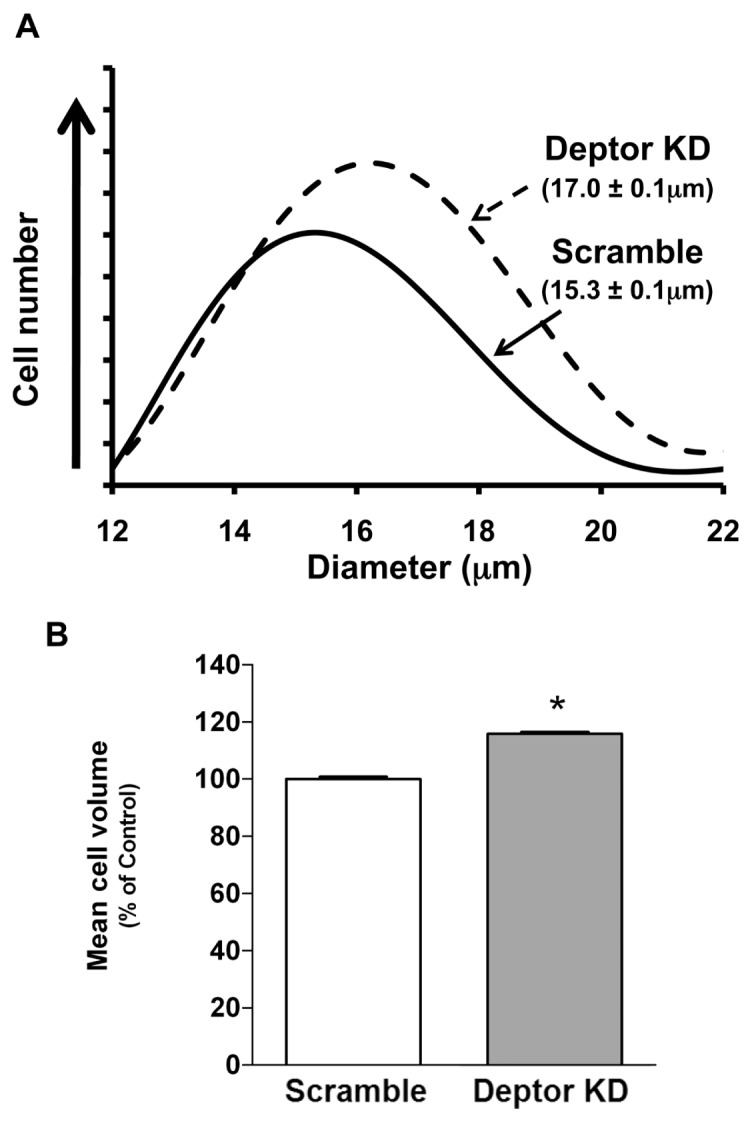
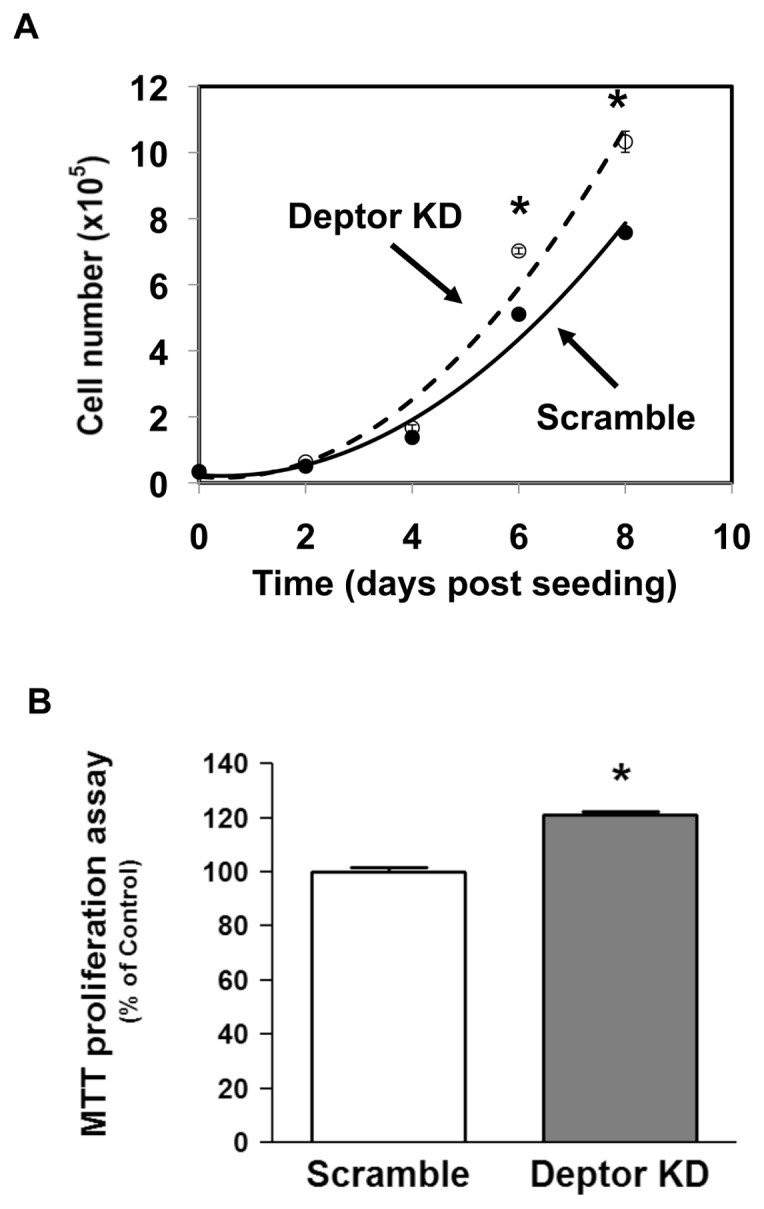
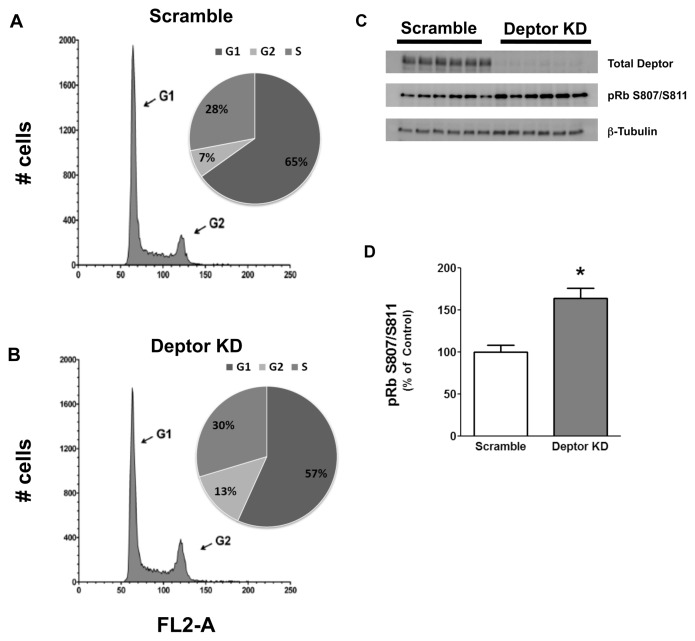
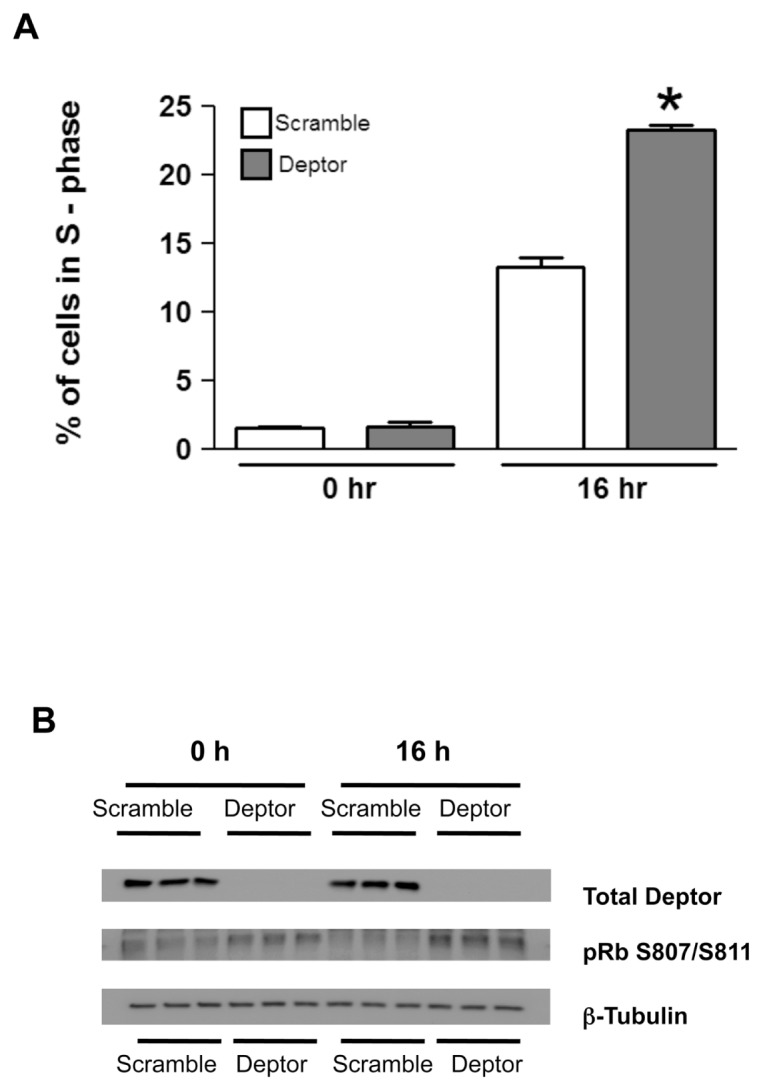
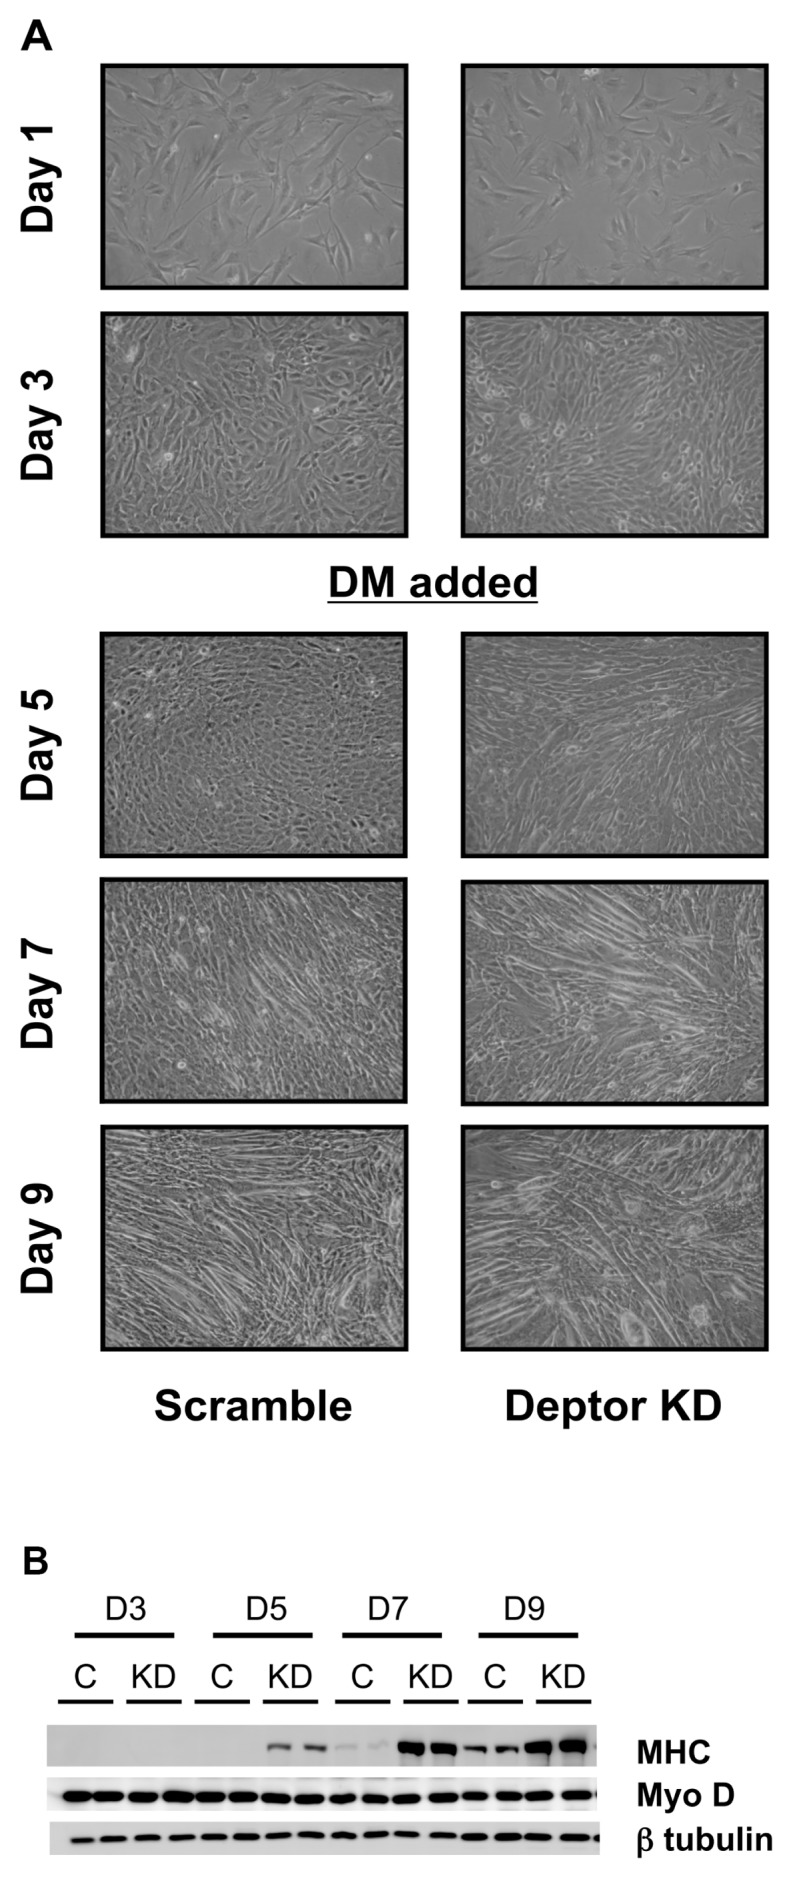
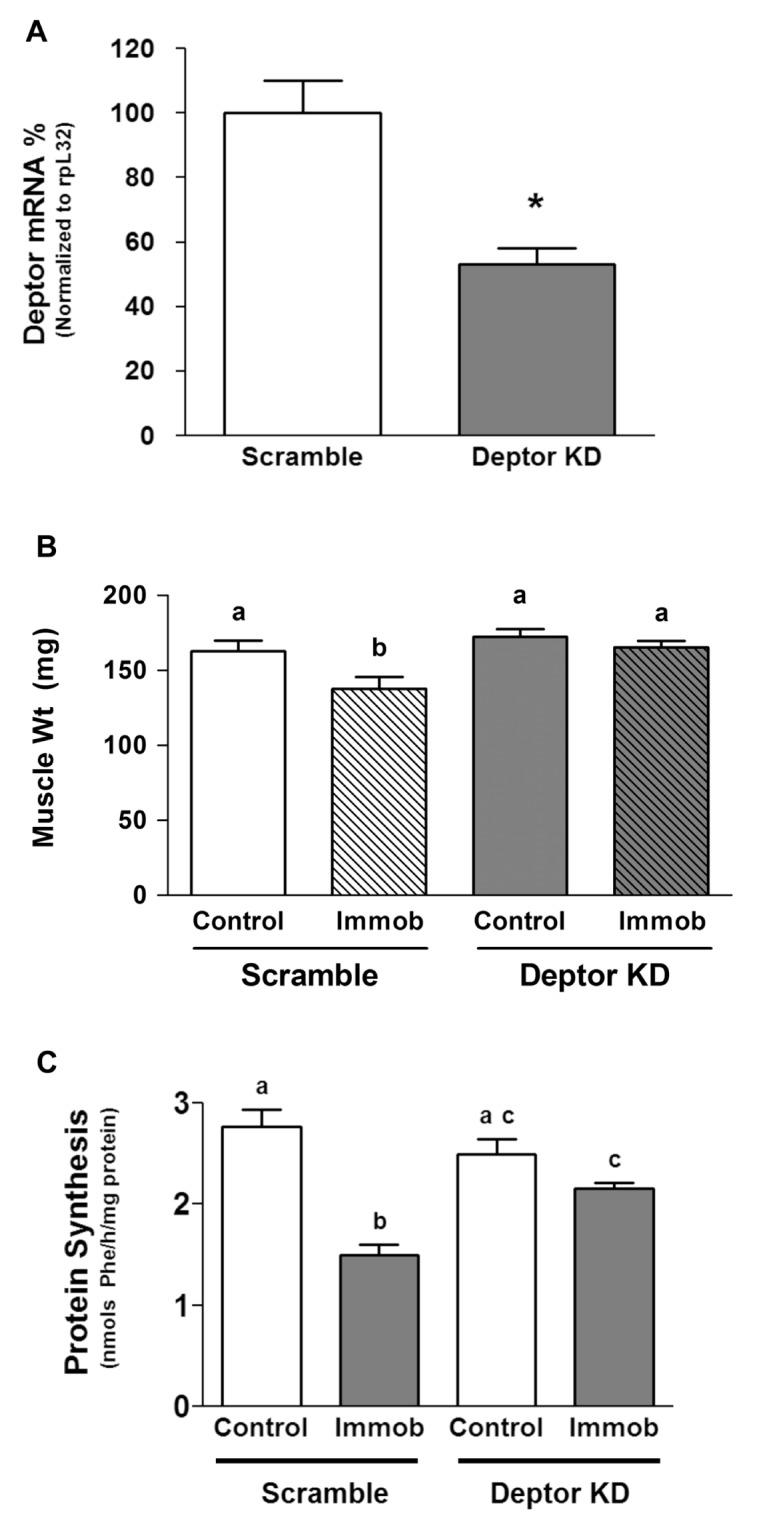
Deptor is an mTOR binding protein that affects cell metabolism. We hypothesized that knockdown (KD) of Deptor in C2C12 myocytes will increase protein synthesis via stimulating mTOR-S6K1 signaling. Deptor KD was achieved using lentiviral particles containing short hairpin (sh)RNA targeting the mouse Deptor mRNA sequence, and control cells were transfected with a scrambled control shRNA. KD reduced Deptor mRNA and protein content by 90%, which increased phosphorylation of mTOR kinase substrates, 4E-BP1 and S6K1, and concomitantly increased protein synthesis. Deptor KD myoblasts were both larger in diameter and exhibited an increased mean cell volume. Deptor KD increased the percentage of cells in the S phase, coincident with an increased phosphorylation (S807/S811) of retinoblastoma protein (pRb) that is critical for the G(1) to S phase transition. Deptor KD did not appear to alter basal apoptosis or autophagy, as evidenced by the lack of change for cleaved caspase-3 and light chain (LC)3B, respectively. Deptor KD increased proliferation rate and enhanced myotube formation. Finally, in vivo Deptor KD (~50% reduction) by electroporation into gastrocnemius of C57/BL6 mice did not alter weight or protein synthesis in control muscle. However, Deptor KD prevented atrophy produced by 3 d of hindlimb immobilization, at least in part by increasing protein synthesis. Thus, our data support the hypothesis that Deptor is an important regulator of protein metabolism in myocytes and demonstrate that decreasing Deptor expression in vivo is sufficient to ameliorate muscle atrophy.
Figures
Similar articles
-
PRAS40 regulates protein synthesis and cell cycle in C2C12 myoblasts.Mol Med. 2010 Sep-Oct;16(9-10):359-71. doi: 10.2119/molmed.2009.00168. Epub 2010 May 5. Mol Med. 2010. PMID: 20464060 Free PMC article.
-
Skeletal muscle protein balance in mTOR heterozygous mice in response to inflammation and leucine.Am J Physiol Endocrinol Metab. 2010 Jun;298(6):E1283-94. doi: 10.1152/ajpendo.00676.2009. Epub 2010 Apr 13. Am J Physiol Endocrinol Metab. 2010. PMID: 20388826 Free PMC article.
-
Disruption of genes encoding eIF4E binding proteins-1 and -2 does not alter basal or sepsis-induced changes in skeletal muscle protein synthesis in male or female mice.PLoS One. 2014 Jun 19;9(6):e99582. doi: 10.1371/journal.pone.0099582. eCollection 2014. PLoS One. 2014. PMID: 24945486 Free PMC article.
-
The molecular target of rapamycin (mTOR) as a therapeutic target against cancer.Cancer Biol Ther. 2003 Jul-Aug;2(4 Suppl 1):S169-77. Cancer Biol Ther. 2003. PMID: 14508096 Review.
-
An evolving role for DEPTOR in tumor development and progression.Neoplasia. 2012 May;14(5):368-75. doi: 10.1593/neo.12542. Neoplasia. 2012. PMID: 22745583 Free PMC article. Review.
Cited by
-
Cell cycle genes are downregulated after adipogenic triggering in human adipose tissue-derived stem cells by regulation of mRNA abundance.Sci Rep. 2019 Apr 4;9(1):5611. doi: 10.1038/s41598-019-42005-3. Sci Rep. 2019. PMID: 30948750 Free PMC article.
-
Regulation of cellular anabolism by mTOR: or how I learned to stop worrying and love translation.Sports Med Health Sci. 2020 Nov 30;2(4):195-201. doi: 10.1016/j.smhs.2020.11.003. eCollection 2020 Dec. Sports Med Health Sci. 2020. PMID: 35782997 Free PMC article. Review.
-
Delayed recovery of skeletal muscle mass following hindlimb immobilization in mTOR heterozygous mice.PLoS One. 2012;7(6):e38910. doi: 10.1371/journal.pone.0038910. Epub 2012 Jun 22. PLoS One. 2012. PMID: 22745686 Free PMC article.
-
mTOR function and therapeutic targeting in breast cancer.Am J Cancer Res. 2017 Mar 1;7(3):383-404. eCollection 2017. Am J Cancer Res. 2017. PMID: 28400999 Free PMC article. Review.
-
Physiological processes underlying organ injury in alcohol abuse.Am J Physiol Endocrinol Metab. 2016 Sep 1;311(3):E605-19. doi: 10.1152/ajpendo.00270.2016. Epub 2016 Jul 19. Am J Physiol Endocrinol Metab. 2016. PMID: 27436613 Free PMC article. Review.
References
-
- Lin TA, et al. PHAS-I as a link between mitogen-activated protein kinase and translation initiation. Science. 1994;266:653–6. - PubMed
-
- Smith MR, et al. Modulation of the mitogenic activity of eukaryotic translation initiation factor-4E by protein kinase C. New Biol. 1991;3:601–7. - PubMed
-
- Kimball SR. Interaction between the AMP-activated protein kinase and mTOR signaling pathways. Med Sci Sports Exerc. 2006;38:1958–64. - PubMed
Publication types
MeSH terms
Substances
Grants and funding
LinkOut - more resources
Full Text Sources
Molecular Biology Databases
Research Materials
Miscellaneous
