. 2011 Jun;121(6):2197-209.
doi: 10.1172/JCI44774. Epub 2011 May 23.

Role of mTOR in podocyte function and diabetic nephropathy in humans and mice

Affiliations

Role of mTOR in podocyte function and diabetic nephropathy in humans and mice

Markus Gödel et al. J Clin Invest. 2011 Jun.

Abstract

Chronic glomerular diseases, associated with renal failure and cardiovascular morbidity, represent a major health issue. However, they remain poorly understood. Here we have reported that tightly controlled mTOR activity was crucial to maintaining glomerular podocyte function, while dysregulation of mTOR facilitated glomerular diseases. Genetic deletion of mTOR complex 1 (mTORC1) in mouse podocytes induced proteinuria and progressive glomerulosclerosis. Furthermore, simultaneous deletion of both mTORC1 and mTORC2 from mouse podocytes aggravated the glomerular lesions, revealing the importance of both mTOR complexes for podocyte homeostasis. In contrast, increased mTOR activity accompanied human diabetic nephropathy, characterized by early glomerular hypertrophy and hyperfiltration. Curtailing mTORC1 signaling in mice by genetically reducing mTORC1 copy number in podocytes prevented glomerulosclerosis and significantly ameliorated the progression of glomerular disease in diabetic nephropathy. These results demonstrate the requirement for tightly balanced mTOR activity in podocyte homeostasis and suggest that mTOR inhibition can protect podocytes and prevent progressive diabetic nephropathy.


Figures

Figure 1
Figure 1. The mTORC1 complex is required for glomerular function.
(A) Schematic illustration of the generation of podocyte-specific Raptor-deficient (RaptorΔpodocyte) mice to interrupt mTORC1 signaling. (B) Western blot analysis of isolated glomeruli from RaptorΔpodocyte and control littermates. (C) Densitometric analysis confirmed significant reduction of glomerular Raptor and pS6 levels and an upregulation of pAkt T308 (n = 3 each; *P < 0.05). (D) 40-week follow-up of RaptorΔpodocyte mice for proteinuria and (E) body weight (n = 9 control, n = 10 RaptorΔpodocyte male mice; *P < 0.05; **P < 0.01). (F) RaptorΔpodocyte mice displayed an increased mortality after 40 weeks of age. Data are expressed as the mean ± SEM.
Figure 2
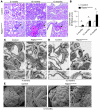
Figure 2. Podocyte-specific deletion of the mTORC1 complex results in progressive glomerulosclerosis.
(A and B) RaptorΔpodocyte mice developed progressive glomerulosclerosis between 2 and 12 months of age. Asterisks in photographs indicate proteinaceous casts in dilated tubules. Arrows indicate glomerulosclerosis with synechia formation (n = 4 mice each; *P < 0.05). Data are expressed as the mean ± SEM. (C and D) TEM analyses identified foot process effacement (arrows) at 4 and 12 months of age. (E) SEM analysis of foot processes at 12 months of age. Scale bars: 20 μm (A); 2 μm (C and D, upper panel); 1 μm (C and D, lower panel); 10 μm (E, first and third scanning electron micrograph); 1 μm (E, second and fourth scanning electron micrograph).
Figure 3
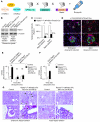
Figure 3. Time-specific deletion of Raptor indicates the importance of mTORC1 activity during glomerular development.
(A) Schematic illustration of the generation of doxycycline-inducible podocyte-specific Raptor-deficient mice. (B) Western blot analysis of isolated glomeruli confirmed Raptor deletion after embryonic or adult doxycycline induction. (C) Densitometric analysis (n = 3 each; *P < 0.05). (D) Embryonic and adult doxycycline induction of mT/mG;NPHS2.rtTA;tetO.Cre reporter mice resulted in podocyte-specific GFP expression. Arrow indicates incomplete GFP expression in podocytes after adult induction. (E) Urinary albumin excretion rates after embryonic or adult Raptor deletion, respectively (C57BL/6 background; embryonic Raptor deletion: n = 7 controls, n = 20 Raptor deletion; adult Raptor deletion 2 months after doxycycline administration, n = 13 each, 6 months after doxycycline administration, n = 8 controls, n = 9 Raptor deletion; **P < 0.001). (F) Adult Raptor deletion on ICR background caused significant albuminuria (n = 14 controls, n = 19 Raptor deletion; **P < 0.001). Data are expressed as the mean ± SEM. (G) Histological analyses 6 months after podocyte-specific Raptor deletion (C57BL/6 background) documenting glomerulosclerosis in embryonic induced mice. In adult doxycycline-induced mice (C57BL/6 background), synechia, but no glomerulosclerosis, could be detected (arrows indicate sclerosed glomeruli or synechia, respectively, arrowheads indicate proteinaceous casts in distal tubules). Scale bars: 20 μm.
Figure 4
Figure 4. Podocyte-specific knockout of the mTORC2 complex results in reduced ability to adapt to stress.
(A) Schematic illustration of the generation of podocyte-specific Rictor-deficient mice (RictorΔpodocyte) to interrupt mTORC2 signaling. (B) Western blot analysis of isolated glomeruli from RictorΔpodocyte mice confirmed the significant reduction of Rictor and pPKCε S729. (C) RictorΔpodocyte mice displayed no significant increase in albuminuria at 12 and 24 months of age (n = 6 control and n = 10 RictorΔpodocyte mice; 12 months, P = 0.11; 24 months, P = 0.24). (DF) No obvious histological and ultrastructural lesions in 12-month-old RictorΔpodocyte mice. (G) RictorΔpodocyte mice exhibited a significantly increased transient albuminuria in the BSA overload model compared with control mice (n = 8 control and n = 8 RictorΔpodocyte mice; *P < 0.05). Scale bars: 20 μm (D); 2 μm (E, upper panel); 1 μm (E, lower panel); 10 μm (F, upper panel); 1 μm (F, lower panel). Data are expressed as the mean ± SEM.
Figure 5
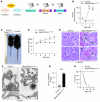
Figure 5. Synergistic action of mTORC1 and mTORC2 complexes are required for glomerular homeostasis.
(A) Schematic illustration of the generation of podocyte-specific Raptor- and Rictor-deficient mice (Raptor/RictorΔpodocyte) to interrupt mTORC1 and mTORC2 signaling. (B) Raptor/RictorΔpodocyte developed an early onset massive albuminuria (n = 7 control and n = 6 Raptor/RictorΔpodocyte mice; **P < 0.01). (C and D) Raptor/RictorΔpodocyte mice exhibited significant growth retardation after 5 weeks of age (n = 8 control and n = 6 Raptor/RictorΔpodocyte mice; *P < 0.05, **P < 0.01). (E) Histological analyses displayed glomerulosclerotic changes with circumferential synechia, crescent formation, vacuolization of podocytes, sometimes complete glomerular obsolescence, and proteinaceous casts in dilated distal tubules. Arrows indicate sclerotic glomeruli; asterisks indicate proteinaceous casts. (F) Raptor/RictorΔpodocyte mice showed global foot process effacement or loss of foot processes with denudation of the basement membrane in ultrastructural analyses (arrows depict foot process effacement; arrowhead indicates loss of foot processes). (G) Raptor/RictorΔpodocyte mice developed renal failure with increased serum creatinine (n = 9 control and n = 5 Raptor/RictorΔpodocyte mice; ***P < 0.0001) and (H) died between 6 and 12 weeks of age. Scale bars: 20 μm (E); 2 μm (F, upper panel); 1 μm (F, lower panel). Data are expressed as the mean ± SEM.
Figure 6
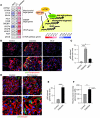
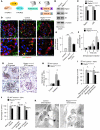
Figure 6. mTORC1 hyperactivation is a molecular signature of diabetic nephropathy.
(A) Glomerular gene expression data of microdissected glomeruli from patients with glomerulopathies; very early diabetic nephropathy (diabetes; n = 22), MCD (n = 5), and controls (pretransplant allograft biopsies, LD, n = 18). mTOR/Raptor target gene expression was upregulated in diabetic nephropathy, but not in MCD. (B) Upregulation of pS6 in glomeruli of patients with diabetic nephropathy, but not in patients with MCD (arrows indicate pS6 signal). (C) Quantitative analysis of glomerular pS6-stained area in glomeruli of patients (n = 3 control, n = 5 for diabetes and minimal change; *P < 0.05, ***P < 0.0001). (D) Upregulation of pS6 in podocytes of STZ-induced diabetic mice (arrows indicate podocytes). (E) Quantitative analysis of glomerular pS6-stained area in glomeruli of diabetic mice (n = 3 mice each). (F) Densitometric analysis after Western blotting of pS6 levels in glomerular lysates of control and STZ-injected diabetic mice (n = 4 mice each). Scale bars: 20 μm (B); 5 μm (D). Data are expressed as the mean ± SEM.
Figure 7
Figure 7. Podocyte-specific genetic inhibition of mTOR hyperactivation prevents progressive glomerular diseases.
(A) Schematic illustration of the generation of podocyte-specific Raptor heterozygous knockout mice (RaptorHet podocyte mice) to counteract mTORC1 hyperactivation. (B) Glomerular Raptor and pS6 levels in RaptorHet podocyte mice. (C) Densitometric analysis of Raptor and pS6 levels (n = 3 mice). (D) Reduced S6 phosphorylation in podocytes of diabetic RaptorHet podocyte mice in the STZ model (arrows indicate pS6 signal in podocytes). (E) Quantitative analysis of glomerular pS6 stained area in glomeruli (n = 3 mice each; **P < 0.001, ***P < 0.0001). (F) The RaptorHet podocyte genotype ameliorated the development of proteinuria in the STZ model (n = 11 control and n = 5 RaptorHet podocyte mice; *P < 0.05). (G) Histological analysis revealed reduced glomerulosclerosis and reduced mesangial matrix expansion in RaptorHet podocyte mice exposed to STZ (arrow indicates sclerosed glomerulus). (H) Glomerulosclerosis index (24) documenting ameliorated diabetic nephropathy in RaptorHet podocyte mice (n = 3 each; *P < 0.05) (I) There was a significant increase in glomerular mean mesangial volume in WT animals compared with RaptorHet podocyte mice after diabetes induction, with no significant difference in mean glomerular volume (n = 3 each; *P < 0.05). (J) Quantitative stereological analyses displayed a significantly increased mean podocyte volume in WT animals compared with RaptorHet podocyte mice after diabetes induction, with no significant difference in the number of podocytes per glomerulus (n = 3 each; *P < 0.05). (K) Ultrastructural analysis displayed increased podocyte volume in WT animals in the STZ model (arrows indicate podocytes; arrowhead indicates mesangial matrix expansion). Scale bars: 5 μm (D); 20 μm (G); 5 μm (K). Data are expressed as the mean ± SEM.

Comment in

  • The targeted podocyte.
    Fogo AB. Fogo AB. J Clin Invest. 2011 Jun;121(6):2142-5. doi: 10.1172/JCI57935. Epub 2011 May 23. J Clin Invest. 2011. PMID: 21606599 Free PMC article.

Similar articles

Cited by

References

    1. Estacio RO, Schrier RW. Diabetic nephropathy: pathogenesis, diagnosis, and prevention of progression. Adv Intern Med. 2001;46:359–408. - PubMed
    1. Wullschleger S, Loewith R, Hall MN. TOR signaling in growth and metabolism. Cell. 2006;124(3):471–484. doi: 10.1016/j.cell.2006.01.016. - DOI - PubMed
    1. Holz MK, Ballif BA, Gygi SP, Blenis J. mTOR and S6K1 mediate assembly of the translation preinitiation complex through dynamic protein interchange and ordered phosphorylation events. Cell. 2005;123(4):569–580. doi: 10.1016/j.cell.2005.10.024. - DOI - PubMed
    1. Shahbazian D, et al. The mTOR/PI3K and MAPK pathways converge on eIF4B to control its phosphorylation and activity. EMBO J. 2006;25(12):2781–2791. doi: 10.1038/sj.emboj.7601166. - DOI - PMC - PubMed
    1. Montagne J, Stewart MJ, Stocker H, Hafen E, Kozma SC, Thomas G. Drosophila S6 kinase: a regulator of cell size. Science. 1999;285(5436):2126–2129. doi: 10.1126/science.285.5436.2126. - DOI - PubMed

Publication types

MeSH terms