CCCTC-binding factor (CTCF) and cohesin influence the genomic architecture of the Igh locus and antisense transcription in pro-B cells
- PMID: 21606361
- PMCID: PMC3111298
- DOI: 10.1073/pnas.1019391108
CCCTC-binding factor (CTCF) and cohesin influence the genomic architecture of the Igh locus and antisense transcription in pro-B cells
Abstract
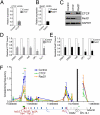
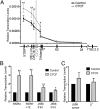
Compaction and looping of the ~2.5-Mb Igh locus during V(D)J rearrangement is essential to allow all V(H) genes to be brought in proximity with D(H)-J(H) segments to create a diverse antibody repertoire, but the proteins directly responsible for this are unknown. Because CCCTC-binding factor (CTCF) has been demonstrated to be involved in long-range chromosomal interactions, we hypothesized that CTCF may promote the contraction of the Igh locus. ChIP sequencing was performed on pro-B cells, revealing colocalization of CTCF and Rad21 binding at ~60 sites throughout the V(H) region and 2 other sites within the Igh locus. These numerous CTCF/cohesin sites potentially form the bases of the multiloop rosette structures at the Igh locus that compact during Ig heavy chain rearrangement. To test whether CTCF was involved in locus compaction, we used 3D-FISH to measure compaction in pro-B cells transduced with CTCF shRNA retroviruses. Reduction of CTCF binding resulted in a decrease in Igh locus compaction. Long-range interactions within the Igh locus were measured with the chromosomal conformation capture assay, revealing direct interactions between CTCF sites 5' of DFL16 and the 3' regulatory region, and also the intronic enhancer (Eμ), creating a D(H)-J(H)-Eμ-C(H) domain. Knockdown of CTCF also resulted in the increase of antisense transcription throughout the D(H) region and parts of the V(H) locus, suggesting a widespread regulatory role for CTCF. Together, our findings demonstrate that CTCF plays an important role in the 3D structure of the Igh locus and in the regulation of antisense germline transcription and that it contributes to the compaction of the Igh locus.
Conflict of interest statement
The authors declare no conflict of interest.
Figures


Similar articles
-
Noncoding transcription within the Igh distal V(H) region at PAIR elements affects the 3D structure of the Igh locus in pro-B cells.Proc Natl Acad Sci U S A. 2012 Oct 16;109(42):17004-9. doi: 10.1073/pnas.1208398109. Epub 2012 Oct 1. Proc Natl Acad Sci U S A. 2012. PMID: 23027941 Free PMC article.
-
Cutting edge: developmental stage-specific recruitment of cohesin to CTCF sites throughout immunoglobulin loci during B lymphocyte development.J Immunol. 2009 Jan 1;182(1):44-8. doi: 10.4049/jimmunol.182.1.44. J Immunol. 2009. PMID: 19109133 Free PMC article.
-
Variable Extent of Lineage-Specificity and Developmental Stage-Specificity of Cohesin and CCCTC-Binding Factor Binding Within the Immunoglobulin and T Cell Receptor Loci.Front Immunol. 2018 Mar 8;9:425. doi: 10.3389/fimmu.2018.00425. eCollection 2018. Front Immunol. 2018. PMID: 29593713 Free PMC article.
-
Genome-wide studies of CCCTC-binding factor (CTCF) and cohesin provide insight into chromatin structure and regulation.J Biol Chem. 2012 Sep 7;287(37):30906-13. doi: 10.1074/jbc.R111.324962. Epub 2012 Sep 5. J Biol Chem. 2012. PMID: 22952237 Free PMC article. Review.
-
Cutting edge: SWI/SNF mediates antisense Igh transcription and locus-wide accessibility in B cell precursors.J Immunol. 2009 Aug 1;183(3):1509-13. doi: 10.4049/jimmunol.0900896. Epub 2009 Jul 13. J Immunol. 2009. PMID: 19596997 Free PMC article. Review.
Cited by
-
Chromatin architecture, CCCTC-binding factor, and V(D)J recombination: managing long-distance relationships at antigen receptor loci.J Immunol. 2013 May 15;190(10):4915-21. doi: 10.4049/jimmunol.1300218. J Immunol. 2013. PMID: 23645930 Free PMC article. Review.
-
Highly diverse TCRα chain repertoire of pre-immune CD8⁺ T cells reveals new insights in gene recombination.EMBO J. 2012 Apr 4;31(7):1666-78. doi: 10.1038/emboj.2012.48. Epub 2012 Feb 28. EMBO J. 2012. PMID: 22373576 Free PMC article.
-
Noncoding transcription within the Igh distal V(H) region at PAIR elements affects the 3D structure of the Igh locus in pro-B cells.Proc Natl Acad Sci U S A. 2012 Oct 16;109(42):17004-9. doi: 10.1073/pnas.1208398109. Epub 2012 Oct 1. Proc Natl Acad Sci U S A. 2012. PMID: 23027941 Free PMC article.
-
Cohesin, CTCF and lymphocyte antigen receptor locus rearrangement.Trends Immunol. 2012 Apr;33(4):153-9. doi: 10.1016/j.it.2012.02.004. Epub 2012 Mar 20. Trends Immunol. 2012. PMID: 22440186 Free PMC article. Review.
-
Temporal analyses reveal a pivotal role for sense and antisense enhancer RNAs in coordinate immunoglobulin lambda locus activation.Nucleic Acids Res. 2023 Oct 27;51(19):10344-10363. doi: 10.1093/nar/gkad741. Nucleic Acids Res. 2023. PMID: 37702072 Free PMC article.
References
-
- Kosak ST, et al. Subnuclear compartmentalization of immunoglobulin loci during lymphocyte development. Science. 2002;296:158–162. - PubMed
Publication types
MeSH terms
Substances
Associated data
- Actions
Grants and funding
- R01 AI023548/AI/NIAID NIH HHS/United States
- T32HL07195/HL/NHLBI NIH HHS/United States
- R01AI82918/AI/NIAID NIH HHS/United States
- R01 AI040227/AI/NIAID NIH HHS/United States
- F32AI084418/AI/NIAID NIH HHS/United States
- R01AI40227/AI/NIAID NIH HHS/United States
- UL1 RR025774/RR/NCRR NIH HHS/United States
- R01AI023548/AI/NIAID NIH HHS/United States
- R01 AI013509/AI/NIAID NIH HHS/United States
- R01 AI029672/AI/NIAID NIH HHS/United States
- R37 AI040227/AI/NIAID NIH HHS/United States
- R01AI082850/AI/NIAID NIH HHS/United States
- R01 AI082918/AI/NIAID NIH HHS/United States
- R01AI13509/AI/NIAID NIH HHS/United States
- F32 AI084418/AI/NIAID NIH HHS/United States
- T32 HL007195/HL/NHLBI NIH HHS/United States
- R01 AI082850/AI/NIAID NIH HHS/United States
- R01AI29672/AI/NIAID NIH HHS/United States
LinkOut - more resources
Full Text Sources
Other Literature Sources
Molecular Biology Databases
Miscellaneous

