

An untargeted multi-technique metabolomics approach to studying intracellular metabolites of HepG2 cells exposed to 2,3,7,8-tetrachlorodibenzo-p-dioxin
- PMID: 21599895
- PMCID: PMC3141663
- DOI: 10.1186/1471-2164-12-251
An untargeted multi-technique metabolomics approach to studying intracellular metabolites of HepG2 cells exposed to 2,3,7,8-tetrachlorodibenzo-p-dioxin
Abstract
Background: In vitro cell systems together with omics methods represent promising alternatives to conventional animal models for toxicity testing. Transcriptomic and proteomic approaches have been widely applied in vitro but relatively few studies have used metabolomics. Therefore, the goal of the present study was to develop an untargeted methodology for performing reproducible metabolomics on in vitro systems. The human liver cell line HepG2, and the well-known hepatotoxic and non-genotoxic carcinogen 2,3,7,8-tetrachlorodibenzo-p-dioxin (TCDD), were used as the in vitro model system and model toxicant, respectively.
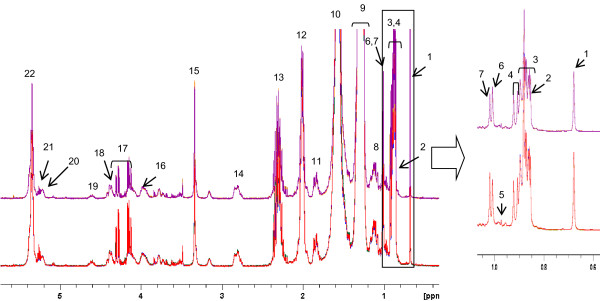
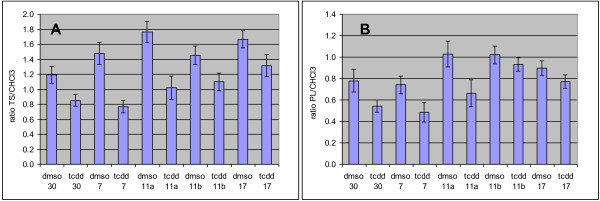
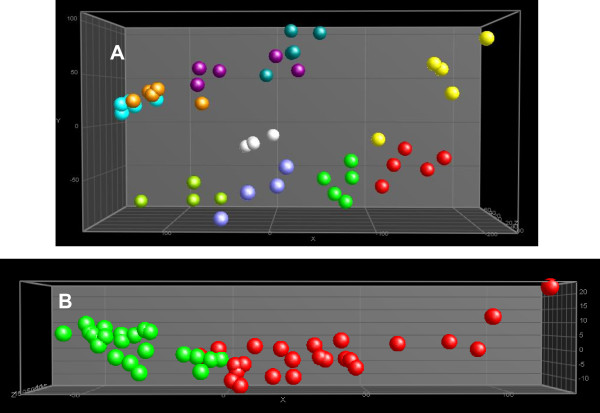
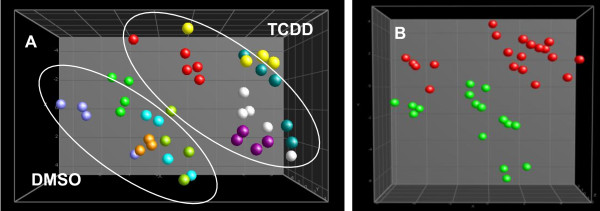
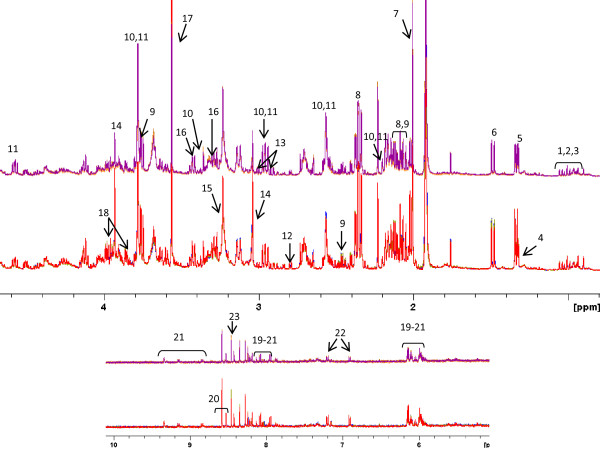
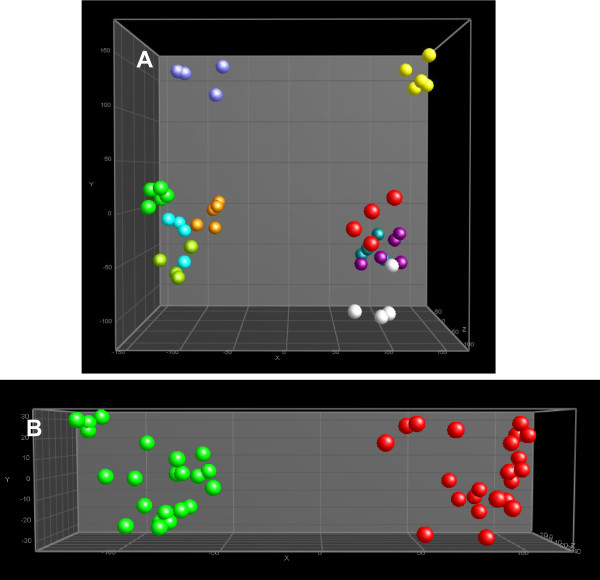
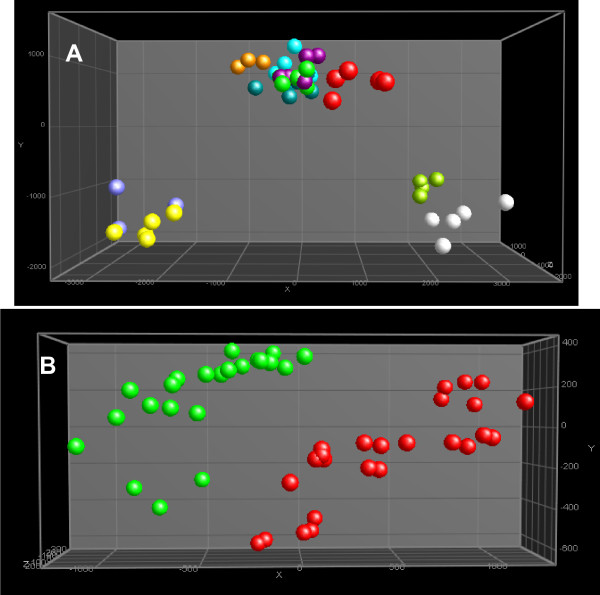
Results: The study focused on the analysis of intracellular metabolites using NMR, LC-MS and GC-MS, with emphasis on the reproducibility and repeatability of the data. State of the art pre-processing and alignment tools and multivariate statistics were used to detect significantly altered levels of metabolites after exposing HepG2 cells to TCDD. Several metabolites identified using databases, literature and LC-nanomate-Orbitrap analysis were affected by the treatment. The observed changes in metabolite levels are discussed in relation to the reported effects of TCDD.
Conclusions: Untargeted profiling of the polar and apolar metabolites of in vitro cultured HepG2 cells is a valid approach to studying the effects of TCDD on the cell metabolome. The approach described in this research demonstrates that highly reproducible experiments and correct normalization of the datasets are essential for obtaining reliable results. The effects of TCDD on HepG2 cells reported herein are in agreement with previous studies and serve to validate the procedures used in the present work.
Figures
Similar articles
-
Translational Metabolomics of Head Injury: Exploring Dysfunctional Cerebral Metabolism with Ex Vivo NMR Spectroscopy-Based Metabolite Quantification.In: Kobeissy FH, editor. Brain Neurotrauma: Molecular, Neuropsychological, and Rehabilitation Aspects. Boca Raton (FL): CRC Press/Taylor & Francis; 2015. Chapter 25. In: Kobeissy FH, editor. Brain Neurotrauma: Molecular, Neuropsychological, and Rehabilitation Aspects. Boca Raton (FL): CRC Press/Taylor & Francis; 2015. Chapter 25. PMID: 26269925 Free Books & Documents. Review.
-
Extending metabolome coverage for untargeted metabolite profiling of adherent cultured hepatic cells.Anal Bioanal Chem. 2016 Feb;408(4):1217-30. doi: 10.1007/s00216-015-9227-8. Epub 2016 Jan 14. Anal Bioanal Chem. 2016. PMID: 26769129
-
Regulation of benzo[a]pyrene-mediated DNA- and glutathione-adduct formation by 2,3,7,8-tetrachlorodibenzo-p-dioxin in human lung cells.Chem Res Toxicol. 2011 Jan 14;24(1):89-98. doi: 10.1021/tx100297z. Epub 2010 Oct 28. Chem Res Toxicol. 2011. PMID: 21028851 Free PMC article.
-
LC-MS untargeted metabolomics assesses the delayed response of glufosinate treatment of transgenic glufosinate resistant (GR) buffalo grasses (Stenotaphrum secundatum L.).Metabolomics. 2021 Feb 20;17(3):28. doi: 10.1007/s11306-021-01776-5. Metabolomics. 2021. PMID: 33609206
-
A review of strategies for untargeted urinary metabolomic analysis using gas chromatography-mass spectrometry.Metabolomics. 2020 May 18;16(6):66. doi: 10.1007/s11306-020-01687-x. Metabolomics. 2020. PMID: 32419109 Review.
Cited by
-
RNA-sequencing analysis of TCDD-induced responses in zebrafish liver reveals high relatedness to in vivo mammalian models and conserved biological pathways.PLoS One. 2013 Oct 30;8(10):e77292. doi: 10.1371/journal.pone.0077292. eCollection 2013. PLoS One. 2013. PMID: 24204792 Free PMC article.
-
Preclinical models of idiosyncratic drug-induced liver injury (iDILI): Moving towards prediction.Acta Pharm Sin B. 2021 Dec;11(12):3685-3726. doi: 10.1016/j.apsb.2021.11.013. Epub 2021 Nov 18. Acta Pharm Sin B. 2021. PMID: 35024301 Free PMC article. Review.
-
Miniaturized method for the quantification of persistent organic pollutants and their metabolites in HepG2 cells: assessment of their biotransformation.Anal Bioanal Chem. 2023 Aug;415(19):4813-4825. doi: 10.1007/s00216-023-04781-w. Epub 2023 Jun 8. Anal Bioanal Chem. 2023. PMID: 37289209 Free PMC article.
-
Metabolomics in toxicology and preclinical research.ALTEX. 2013;30(2):209-25. doi: 10.14573/altex.2013.2.209. ALTEX. 2013. PMID: 23665807 Free PMC article.
-
Comparative metabolomic and genomic analyses of TCDD-elicited metabolic disruption in mouse and rat liver.Toxicol Sci. 2012 Jan;125(1):41-55. doi: 10.1093/toxsci/kfr262. Epub 2011 Sep 29. Toxicol Sci. 2012. PMID: 21964420 Free PMC article.
References
-
- Fernie AR, Schauer N. Metabolomics-assisted breeding: a viable option for crop improvement? Trends Genet. 2008;25:39–48. - PubMed
Publication types
MeSH terms
Substances
LinkOut - more resources
Full Text Sources
Miscellaneous
