. 2011 May;134(Pt 5):1293-314.
doi: 10.1093/brain/awr074.

Endogenous regulatory T lymphocytes ameliorate amyotrophic lateral sclerosis in mice and correlate with disease progression in patients with amyotrophic lateral sclerosis

Affiliations

Endogenous regulatory T lymphocytes ameliorate amyotrophic lateral sclerosis in mice and correlate with disease progression in patients with amyotrophic lateral sclerosis

David R Beers et al. Brain. 2011 May.

Abstract

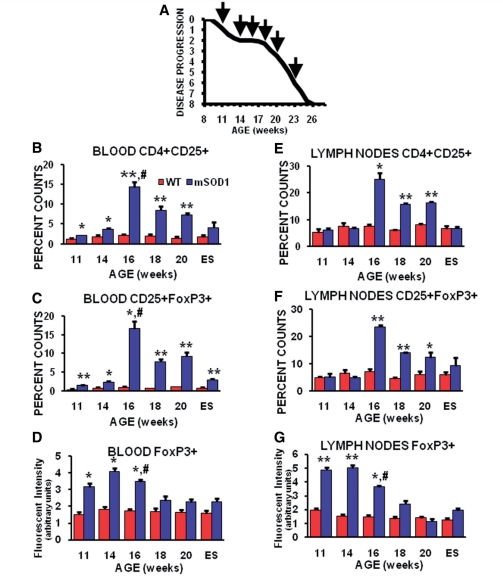
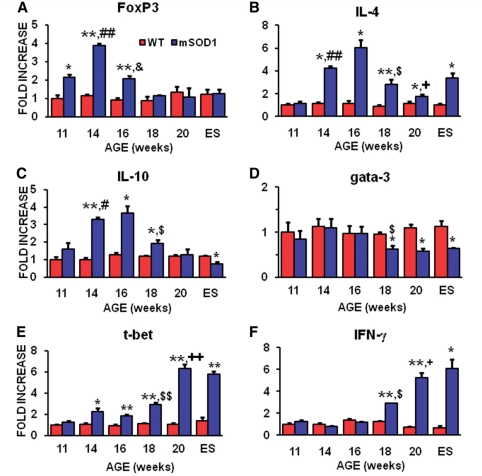
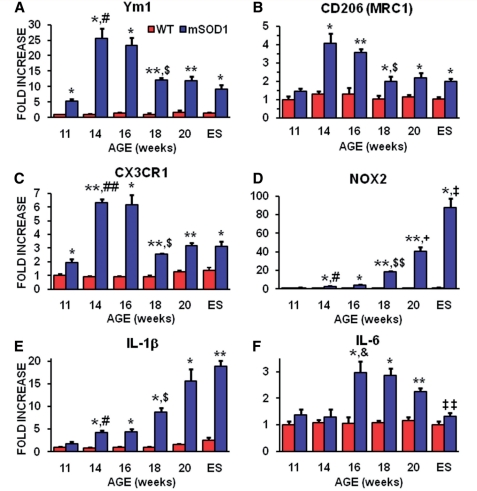
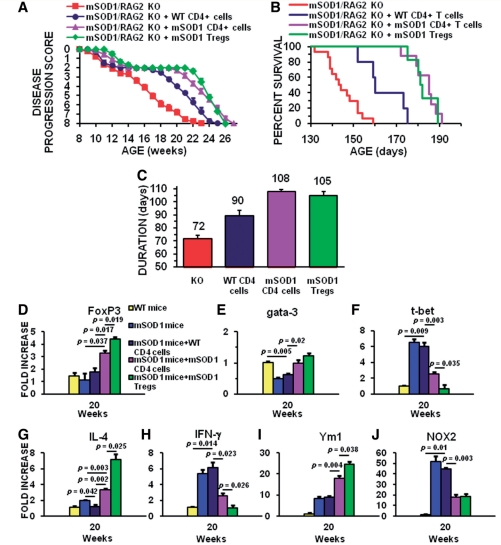
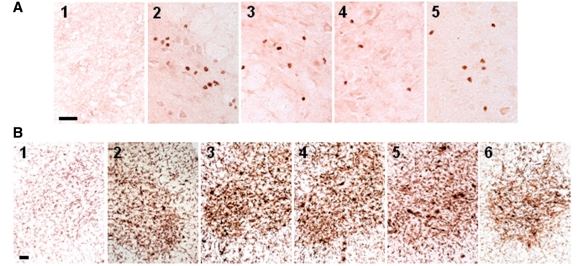
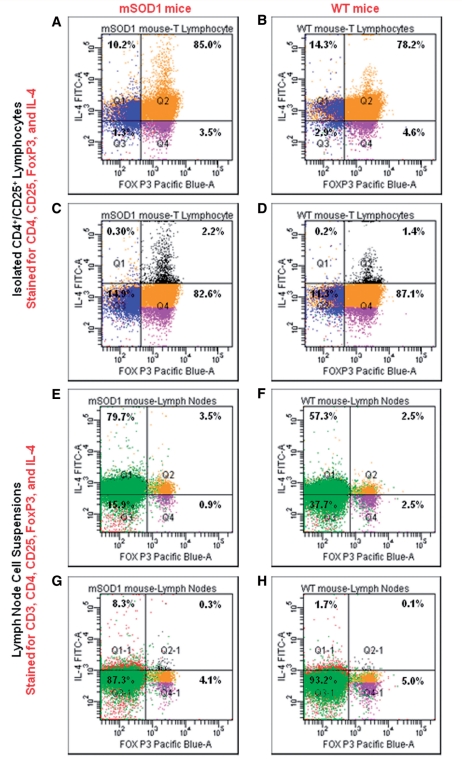
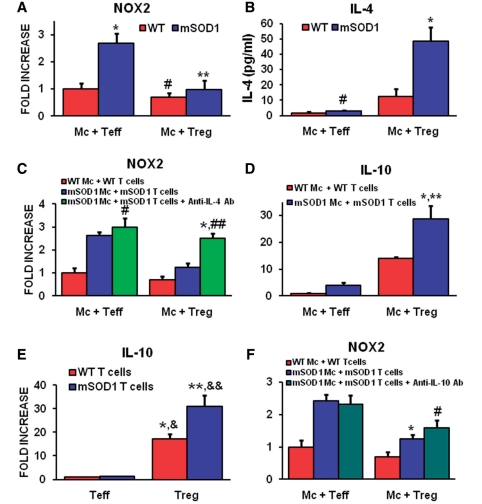
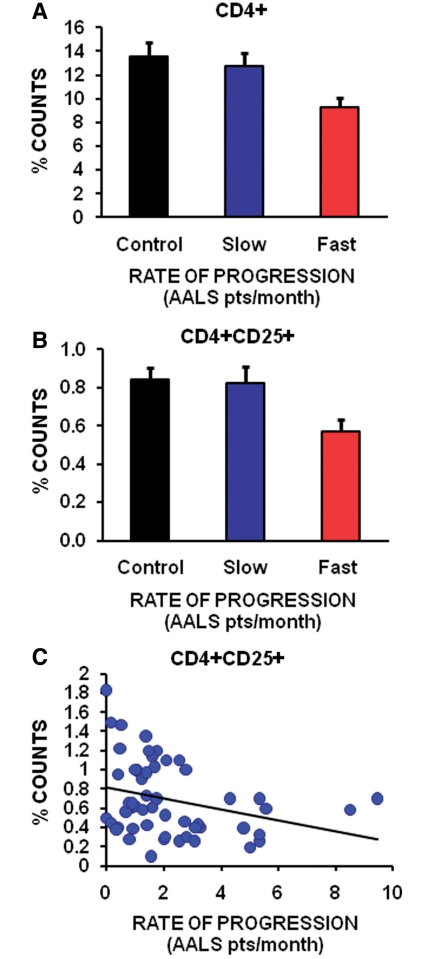
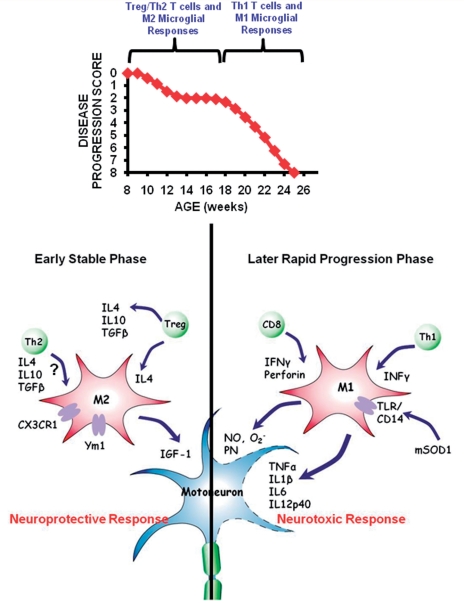
Amyotrophic lateral sclerosis is a relentless and devastating adult-onset neurodegenerative disease with no known cure. In mice with amyotrophic lateral sclerosis, CD4+ T lymphocytes and wild-type microglia potentiate protective inflammatory responses and play a principal role in disease pathoprogression. Using this model, we demonstrate that endogenous T lymphocytes, and more specifically regulatory T lymphocytes, are increased at early slowly progressing stages, augmenting interleukin-4 expression and protective M2 microglia, and are decreased when the disease rapidly accelerates, possibly through the loss of FoxP3 expression in the regulatory T lymphocytes. Without ex vivo activation, the passive transfer of wild-type CD4+ T lymphocytes into amyotrophic lateral sclerosis mice lacking functional T lymphocytes lengthened disease duration and prolonged survival. The passive transfer of endogenous regulatory T lymphocytes from early disease stage mutant Cu2+/Zn2+ superoxide dismutase mice into these amyotrophic lateral sclerosis mice, again without ex vivo activation, were substantially more immunotherapeutic sustaining interleukin-4 levels and M2 microglia, and resulting in lengthened disease duration and prolonged survival; the stable disease phase was extended by 88% using mutant Cu2+/Zn2+ superoxide dismutase regulatory T lymphocytes. A potential mechanism for this enhanced life expectancy may be mediated by the augmented secretion of interleukin-4 from mutant Cu2+/Zn2+ superoxide dismutase regulatory T lymphocytes that directly suppressed the toxic properties of microglia; flow cytometric analyses determined that CD4+/CD25+/FoxP3+ T lymphocytes co-expressed interleukin-4 in the same cell. These observations were extended into the amyotrophic lateral sclerosis patient population where patients with more rapidly progressing disease had decreased numbers of regulatory T lymphocytes; the numbers of regulatory T lymphocytes were inversely correlated with disease progression rates. These data suggest a cellular mechanism whereby endogenous regulatory T lymphocytes are immunocompetent and actively contribute to neuroprotection through their interactions with microglia. Furthermore, these data suggest that immunotherapeutic interventions must begin early in the pathogenic process since immune dysfunction occurs at later stages. Thus, the cumulative mouse and human amyotrophic lateral sclerosis data suggest that increasing the levels of regulatory T lymphocytes in patients with amyotrophic lateral sclerosis at early stages in the disease process may be of therapeutic value, and slow the rate of disease progression and stabilize patients for longer periods of time.


Figures

Figure 1
Figure 1
Flow cytometric analyses showed the temporal changes of T lymphocyte sub-populations in blood and lymph nodes of mSOD1 mice. (A) Graph of the disease progression curve and time points (arrows) when flow cytometry and quantitative reverse transcriptase polymerase chain reaction assays were performed on wild-type and mSOD1 mice. Each time point represents the mean of n = 3 mSOD1 and n = 3 wild-type (WT) littermate mice. (B) CD4+CD25+ cells were increased in the blood of mSOD1 mice at each time point examined except at end stage disease. (C) Including end stage disease, CD25+FoxP3+ cells were increased in the blood of mSOD1 mice at each time point examined. (D) The FoxP3 fluorescence/cell intensity in the blood suggests that the Tregs have a suppressive function at 11 through 16 weeks, but these suppressive capabilities are possibly lost at 18 weeks through end stage disease. (E) In lymph nodes, CD4+CD25+ cells were increased between 16 and 20 weeks, but returned to wild-type levels at end stage disease. (F) CD25+FoxP3+ cells followed a similar pattern as CD4+CD25+ cells in lymph nodes compared with wild-type mice. (G) As occurred in the blood, the FoxP3 fluorescence/cell intensity in the lymph nodes suggests that the Tregs have a suppressive function between 11 and 16 weeks, but possibly lose this capability at 18 weeks through to end stage disease. ES= end stage; *P≤0.05, mSOD1 compared with wild-type mice; **P ≤ 0.01, mSOD1 compared with wild-type mice; and # P ≤ 0.05, 16 week compared with 18 week mSOD1 mice.
Figure 2
Figure 2
Quantitative reverse transcriptase polymerase chain reaction analyses revealed the temporal and differential expression of markers for subsets of T lymphocytes and their prototypic cytokines during disease progression. (A) FoxP3 messenger RNA, currently the most reliable marker of Tregs, was increased in the spinal cords of mSOD1 mice at 11, 14 and 16 weeks of age, but was at wild-type levels at 18 weeks through to end stage (ES) disease. (B) The messenger RNA for IL-4, the prototypic Th2 released cytokine that is also released by Tregs, was first increased during the stable disease phase, then abruptly dropped at the beginning of the rapidly progressing phase, but was still elevated until end stage disease. (C) IL-10 messenger RNA, another Tregs and Th2 released cytokine, was increased during the stable phase of disease; IL-10 abruptly decreased at the beginning of the rapidly progressing disease phase and continued to decline until end stage disease. (D) The message for Gata-3, a master transcription factor expressed in Th2 lymphocytes, was suppressed at 18 weeks through to end stage disease. (E) In contrast to Gata-3, T-bet messenger RNA, a master transcription factor expressed in Th1 lymphocytes, was increased at 14 through to 18 weeks, and then increased further at 20 weeks and end stage disease. (F) The messenger RNA for IFN-γ, the prototypic pro-inflammatory cytokine released by Th1 cells, was increased at 18 and 20 weeks, and at end stage disease. n = 3 mSOD1 and n = 3 wild-type littermate mice at each time point. *P ≤ 0.05, mSOD1 compared with wild-type mice; **P ≤ 0.01, mSOD1 compared with wild-type mice; #P ≤ 0.05, 11 week compared with 14 week mSOD1 mice; ##P ≤ 0.01, 11 week compared with 14 week mSOD1 mice; &P ≤ 0.01, 14 week compared with 16 week mSOD1 mice; $P ≤ 0.05, 16 week compared with 18 week mSOD1 mice; $$P ≤ 0.01, 16 week compared with 18 week mSOD1 mice; +P ≤ 0.05, 18 week compared with 20 week mSOD1 mice; and ++P ≤ 0.01, 18 week compared with 20-week mSOD1 mice.
Figure 3
Figure 3
Quantitative reverse transcriptase polymerase chain reaction analyses showed a differential expression of glial messenger RNAs during disease progression in the spinal cords of mSOD1 mice. (A) Ym1 messenger RNA, a reliable marker of M2 macrophages/microglia, was increased in spinal cords of mSOD1 mice at 11 through to 16 weeks of age, and remained elevated through to end stage (ES) disease compared with wild-type mice. (B) CD206, another marker of M2 microglia, mirrored that of Ym1. (C) CX3CR1 (fractalkine receptor) messenger RNA, expressed in microglia, dendritic cells and T lymphocyte subsets, and has been shown to protect motoneurons by suppressing microglial toxicity, was increased in spinal cords of mSOD1 mice at 11 through to 16 weeks of age, and remained elevated through to end stage disease compared with wild-type mice. (D) NOX2 messenger RNA, the prototypic subunit of nicotinamide adenine dinucleotide phosphate oxidase found in macrophages/microglia producing O2, was increased at 14 and 16 weeks of age, and was dramatically increased at 18 weeks (18-fold), the beginning of the rapidly progressing disease phase (Beers et al., 2008). Notice the scale of the ordinate in this graph. (E) IL-1β messenger RNA expression pattern, released by microglia, was increased at 14 and 16 weeks of age in spinal cords of mSOD1 mice compared with wild-type mice, and was increased further at 18 weeks, the beginning of the rapidly progressing disease phase (Beers et al., 2008), through to end stage disease. (F) The messenger RNA level for IL-6, another Th1-induced cytokine that completely inhibits the generation of FoxP3+ Tregs and possibly key factor that transforms Tregs/Th2 and M2 responses into Th1/M1 responses, was increased at 16 through to 20 weeks of age. n = 3 mSOD1 and n = 3 wild-type littermate mice at each time point. *P ≤ 0.05, mSOD1 compared with wild-type mice; **P ≤ 0.01, mSOD1 compared with wild-type mice; #P ≤ 0.05, 11-week mSOD1 mice compared with 14-week mSOD1 mice; ##P ≤ 0.01, 11-week mSOD1 mice compared with 14-week mSOD1 mice; &P ≤ 0.05, 14-week mSOD1 mice compared with 16-week mSOD1 mice; $P ≤ 0.01, 16-week mSOD1 mice compared with 18-week mSOD1 mice; $$P ≤ 0.01, 16-week mSOD1 mice compared with 18-week mSOD1 mice; +P ≤ 0.05, 18-week mSOD1 mice compared with 20-week mSOD1 mice; P ≤ 0.05, 20-week mSOD1 mice compared with end stage mSOD1 mice; and ‡‡P ≤ 0.01, 20-week mSOD1 mice compared with end stage mSOD1 mice.
Figure 4
Figure 4
Tregs provide a cellular mechanism that extends the stable disease phase and prolongs survival in mSOD1/RAG2−/− mice. Total mSOD1 CD4+ T lymphocytes and CD4+CD25+ Tregs were harvested from mSOD1 mice during the stable disease phase (100–115 days of age), and total wild-type CD4+ T lymphocytes were isolated from 100- to 115-day-old wild-type (WT) mice. Neither the total mSOD1 CD4+ T lymphocytes nor the total wild-type CD4+ T lymphocytes were expanded ex vivo. (A) The stable disease phase in ALS mice, represented by the plateau in the disease progression curve, was extended 2 weeks following the passive transfer of total mSOD1 CD4+ T lymphocytes (purple curve) into mSOD1/RAG2−/− mice (n = 10) compared with mSOD1/RAG2−/− mice receiving age-matched total wild-type CD4+ T lymphocytes (dark blue curve; n = 6; P < 0.001). The stable disease phase did not differ between mSOD1/RAG2−/− mice passively transferred with total wild-type CD4+ T lymphocytes. The passive transfer of mSOD1 Tregs further extended the stable disease phase by 1.5 weeks in mSOD1/RAG2−/− mice (green curve; n = 6) compared with mSOD1/RAG2−/− mice passively transferred with total mSOD1 CD4+ T lymphocytes (purple curve; P = 0.028). The passive transfer of mSOD1 Tregs extended the stable disease phase by 100% compared with the passive transfer of wild-type CD4+ T lymphocytes. mSOD1 Tregs extended the stable disease phase by 8 weeks compared with untreated mSOD1/RAG2−/− mice (red curve; n = 14). (B) The passive transfer of total mSOD1 CD4+ T lymphocytes (purple curve) or mSOD1 Tregs (green curve) into mSOD1/RAG2−/− mice prolonged survival compared with mSOD1/RAG2−/− mice passively transferred with total wild-type CD4+ T lymphocytes (dark blue curve; P < 0.001 and P = 0.001, respectively). Passive transfer of total mSOD1 CD4+ T lymphocytes or mSOD1 Tregs into mSOD1/RAG2−/− mice prolonged survival by 38 days (26%) compared with untreated mSOD1/RAG2−/− mice (red curve, P < 0.001 and P < 0.001, respectively). Passive transfer of total mSOD1 CD4+ T lymphocytes into mSOD1/RAG2−/− mice did not prolong survival compared with mSOD1/RAG2−/− mice receiving mSOD1 Tregs. (C) Passive transfer of total mSOD1 CD4+ T lymphocytes (purple bar) or mSOD1 Tregs (green bar) into mSOD1/RAG2−/− mice extended duration compared with mSOD1/RAG2−/− mice passively transferred with total wild-type CD4+ T lymphocytes (dark blue bar; P = 0.003 and P = 0.018, respectively). Passive transfer of total mSOD1 CD4+ T lymphocytes or mSOD1 Tregs into mSOD1/RAG2−/− mice extended duration by 36 days (50%) and 33 days (46%) compared with untreated mSOD1/RAG2−/− mice (red bar; P < 0.001 and P < 0.001, respectively). Because disease onset was not different among all groups, disease duration was not different between mSOD1/RAG2−/− mice passively transferred with total mSOD1 CD4+ T lymphocytes and mSOD1/RAG2−/− mice receiving mSOD1 Tregs. (D) At 20 weeks of age, the passive transfer of mSOD1 CD4+ (purple bar) or CD4+/CD25+ T lymphocytes (green bar) increased the FoxP3 expression levels in the spinal cords of mSOD1/RAG2−/− mice compared with untreated wild-type (yellow bar) or untreated mSOD1 mice (blue bar), or compared with mSOD1/RAG2−/− mice receiving wild-type CD4+ T lymphocytes (dark blue bar). (E) Gata-3 messenger RNA was suppressed in spinal cords of 20-week-old mSOD1/RAG2−/− mice receiving wild-type CD4+ T lymphocytes (dark blue bar) compared with wild-type mice (yellow bar); similar results were obtained with untreated mSOD1 mice (blue bar). (F) T-bet messenger RNA was increased in spinal cords of both 20-week-old mSOD1/RAG2−/− mice receiving wild-type CD4+ T lymphocytes (dark blue bar) and untreated mSOD1 mice (blue bar) compared with wild-type mice (yellow bar). (G) The passive transfer of mSOD1 CD4+ (purple bar) or CD4+/CD25+ T lymphocytes (green bar) increased the messenger RNA levels of IL-4 in the spinal cords of 20-week-old mSOD1/RAG2−/− mice compared with untreated wild-type (yellow bar) or untreated mSOD1 mice (blue bar), or compared with mSOD1/RAG2−/− mice receiving wild-type CD4+ T lymphocytes (dark blue bar). (H) The passive transfer of wild-type CD4+ (purple bar) increased the messenger RNA levels of IFN-γ in the spinal cords of 20-week-old mSOD1/RAG2−/− mice compared with untreated wild-type (yellow bar); similar results were obtained with untreated mSOD1 mice (blue bar). However, the passive transfer of mSOD1 CD4+ (purple bar) or CD4+/CD25+ T lymphocytes (green bar) decreased the messenger RNA levels of IFN-γ in 20-week-old mSOD1/RAG2−/− mice. (I) The spinal cords of 20-week-old mSOD1/RAG2−/− mice passively transferred with mSOD1 CD4+ (purple bar) or CD4+/CD25+ T lymphocytes (green bar) had increased levels of Ym1, a marker of M2 microglia/macrophages, compared with untreated wild-type (yellow bar) or untreated mSOD1 mice (blue bar), or compared with mSOD1/RAG2−/− mice receiving wild-type CD4+ T lymphocytes (dark blue bar). (J) As a marker of toxic microglia/macrophages, NOX2 messenger RNA was decreased in the spinal cords of 20-week-old mSOD1/RAG2−/− mice passively transferred with mSOD1 CD4+ (purple bar) or CD4+/CD25+ T lymphocytes (green bar) compared with untreated wild-type (yellow bar) or untreated mSOD1 mice (blue bar) or compared with mSOD1/RAG2−/− mice receiving wild-type CD4+ T lymphocytes (dark blue bar). KO= knock out.
Figure 5
Figure 5
CD3+/CD4+ T lymphocytes were observed in lumbar spinal cord sections of ALS mice. (A) CD3+ T lymphocytes were not detected in lumbar spinal cord of untreated mSOD1/RAG2−/− mice (A1) but were detected in lumbar spinal cords of mSOD1/RAG2+/− mice (A2) and mSOD1/RAG2−/− mice passively transferred with total wild-type or mSOD1 CD4+ T lymphocytes (A3 and A4). At 105-days-old, during the stable disease phase, CD4+ cells were detected in the lumbar spinal cords of mSOD1/RAG2−/− mice passively transferred with CD4+CD25+ T lymphocytes (A5). (B) CD11b immunohistochemistry demonstrated that morphological microglial activation was attenuated in untreated end stage disease mSOD1/RAG2−/− mice (B1) (Beers et al., 2008). Microglial morphology was similar among end stage disease mSOD1/RAG2+/− mice (B2) and end stage disease mSOD1/RAG2−/− mice passively transferred with total wild-type or mSOD1 CD4+ T lymphocytes (B3 and B4). Microglia are morphologically activated at 23 weeks of age, rapidly progressing phase, in mSOD1/RAG2−/− mice passively transferred with stable phase mSOD1 Tregs (B5). Microglia in the lumbar spinal cords of end stage disease mSOD1/RAG2−/− mice passively transferred with stable phase mSOD1 Tregs appeared less morphologically activated (B6). Scale bars= (A) 100 µm; (B) 50 µm.
Figure 6
Figure 6
IL-4 and FoxP3 are co-expressed in CD4+/CD25+ T lymphocytes. (A and B) CD4+/CD25+ T lymphocytes were isolated in an identical manner from the spleens and lymph nodes of mSOD1 and wild-type (WT) mice as used flow the repetitive passive transfer studies. Using antibodies to CD4, CD25, FoxP3 and IL-4, flow cytometric analyses demonstrated on the single cell level the co-expression IL-4 and FoxP3 in CD4+/CD25+ T lymphocytes in mSOD1 and wild-type mice. (C and D) Moving the gates up, there are more IL-4+ high/FoxP3+ T lymphocytes in mSOD1 CD4+/CD25+ T lymphocytes than with wild-type CD4+/CD25+ T lymphocytes. (E and F) To eliminate possible IL-4 expression alterations in the pool of CD+/CD25+ T lymphocytes, we also prepared fresh lymph node cell suspensions from mSOD1 and wild-type mice. The cells were immediately subjected to flow cytometric analyses using antibodies to CD3, CD4, CD25, FoxP3 and IL-4. Again, IL-4 was found to be co-expressed with FoxP3 on a single cell level in CD3+/CD4+/CD25+ T lymphocytes. (G and H) Moving the gates up, there are more IL-4+ high/FoxP3+ T lymphocytes in mSOD1 CD3+/CD4+/CD25+ T lymphocytes than with wild-type CD3+/CD4+/CD25+ T lymphocytes. The numbers in each quadrant in each of the eight flow cytometry panels reflect the percentages of the total number of live cells in that quadrant.
Figure 7
Figure 7
Tregs suppress toxic microglial responses through a mechanism involving the upregulation of IL-4. Wild-type (WT) and mSOD1 primary microglia (mc) were harvested from 130-day-old mice. Wild-type and mSOD1 T lymphocytes were obtained from 100-day-old mice. (A) Co-culturing mSOD1 Teffs with mSOD1 microglia increased NOX2 messenger RNA expression compared with wild-type microglia co-cultured with wild-type Teffs (*P = 0.021). Co-culturing wild-type microglia with wild-type Tregs did not change the expression of NOX2 compared with wild-type microglia co-cultured with wild-type Teffs (#P ≥ 0.05). mSOD1 Tregs obtained from stable disease phase mSOD1 mice reduced the NOX2 messenger RNA expression from mSOD1 microglia to levels detected in wild-type microglia/Tregs co-cultures. mSOD1 microglia/Tregs expressed less NOX2 messenger RNA than mSOD1 microglia/Teffs (**P = 0.022). (B) IL-4 levels in the supernatant from wild-type Teffs/microglia were not different than the supernatant IL-4 levels from mSOD1 Teffs / microglia co-cultures (#P ≥ 0.05). Co-culturing stable phase mSOD1 Tregs with mSOD1 microglia increased the amount of IL-4 in the supernatant compared with wild-type microglia/Tregs co-cultures (*P = 0.007). (C) Although anti-IL-4 blocking antibodies (Ab) did not alter the expression levels on NOX2 messenger RNA in mSOD1 microglia/Teffs co-cultures, they increased the NOX2 messenger RNA expression in mSOD1 microglia/Tregs compared with untreated mSOD1 microglia/Tregs co-cultures (*P = 0.0008) and were not different from mSOD1 microglia/Teffs co-cultures treated with anti-IL-4 antibodies (##P ≥ 0.05), suggesting that the suppressive effects of mSOD1 Tregs was mediated through an IL-4 mechanism (Zhao et al., 2006). (D) IL-10 messenger RNA was increased in mSOD1 microglia/Tregs co-cultures compared with wild-type microglia/Tregs (*P = 0.032) or mSOD1 microglia/Teffs co-cultures (**P = 0.004). (E) Both wild-type Tregs and mSOD1 Tregs had increased IL-10 messenger RNA levels compared with wild-type Teffs (*P < 0.001 and **P = 0.008) or mSOD1 Teffs (&P = 0.0004 and &&P = 0.008). (F) Again, mSOD1 Tregs reduced the level of NOX2 messenger RNA expression in mSOD1 microglia/Tregs co-cultures compared with mSOD1 microglia/Teffs (*P < 0.001), but the anti-IL-10 blocking antibodies did not reverse NOX2 messenger RNA expression in mSOD1 microglia/Tregs compared with untreated mSOD1 microglia/Tregs co-cultures (#P ≥ 0.05), suggesting that the suppressive effects of mSOD1 Tregs did not involve IL-10.
Figure 8
Figure 8
Decreased numbers of Tregs in blood are inversely correlated with a rapid rate of progression in patients with ALS. (A) Using the Appel ALS (AALS) scoring system, there were 27% fewer CD4+ T lymphocytes in rapidly progressing patients with ALS (a disease progression rate of ≥1.5 Appel ALS points/month) compared with slowly progressing patients with ALS (a disease progression rate of <1.5 Appel ALS points/month; P = 0.02). Rapidly progressing patients had fewer CD4+ T lymphocytes than volunteer subjects (P = 0.009). (B) There were 31% fewer CD4+CD25+ Tregs in rapidly progressing patients (≥1.5 Appel ALS points/month) compared with slowly progressing patients (<1.5 Appel ALS points/month) (P = 0.02); volunteer control subjects had 47% more CD4+CD25+ Tregs than rapidly progressing patients (P = 0.003). (C) There was a linear inverse correlation between the number of CD4+CD25+ Tregs in the blood of patients with ALS and rate of disease progression (P = 0.03).
Figure 9
Figure 9
In ALS mice, there is a transformation from protective stabilizing effects of Tregs and M2 microglia to an injurious Teffs and M1 microglial response. The presence of Tregs shifts the balance of microglia responses from cytotoxicity to increased neuroprotection.

Similar articles

Cited by

References

    1. Alexianu ME, Kozovska M, Appel SH. Immune reactivity in a mouse model of familial ALS correlates with disease progression. Neurology. 2001;57:1282–9. - PubMed
    1. Aloisi F, De Simone R, Columba-Cabezas S, Penna G, Adorini L. Functional maturation of adult mouse resting microglia into an APC is promoted by granulocyte-macrophage colony-stimulating factor and interaction with Th1 cells. J Immunol. 2000;164:1705–12. - PubMed
    1. Appel SH, Beers DR, Henkel JS. T cell-microglial dialogue in Parkinson's; disease and amyotrophic lateral sclerosis: are we listening? Trends Immunol. 2010;31:7–17. - PMC - PubMed
    1. Avidan H, Kipnis J, Butovsky O, Caspi RR, Schwartz M. Vaccination with autoantigen protects against aggregated beta-amyloid and glutamate toxicity by controlling microglia: effect of CD4+CD25+ T cells. Eur J Immunol. 2004;34:3434–45. - PubMed
    1. Banerjee R, Mosley RL, Reynolds AD, Dhar A, Jackson-Lewis V, Gordon PH, et al. Adaptive immune neuroprotection in G93A-SOD1 amyotrophic lateral sclerosis mice. PLoS One. 2008;3:e2740. - PMC - PubMed

Publication types

MeSH terms