. 2011 Aug;39(15):6568-84.
doi: 10.1093/nar/gkr340. Epub 2011 May 16.

Ultrafine anaphase bridges, broken DNA and illegitimate recombination induced by a replication fork barrier

Affiliations

Ultrafine anaphase bridges, broken DNA and illegitimate recombination induced by a replication fork barrier

Sevil Sofueva et al. Nucleic Acids Res. 2011 Aug.

Abstract

Most DNA double-strand breaks (DSBs) in S- and G2-phase cells are repaired accurately by Rad51-dependent sister chromatid recombination. However, a minority give rise to gross chromosome rearrangements (GCRs), which can result in disease/death. What determines whether a DSB is repaired accurately or inaccurately is currently unclear. We provide evidence that suggests that perturbing replication by a non-programmed protein-DNA replication fork barrier results in the persistence of replication intermediates (most likely regions of unreplicated DNA) into mitosis, which results in anaphase bridge formation and ultimately to DNA breakage. However, unlike previously characterised replication-associated DSBs, these breaks are repaired mainly by Rad51-independent processes such as single-strand annealing, and are therefore prone to generate GCRs. These data highlight how a replication-associated DSB can be predisposed to give rise to genome rearrangements in eukaryotes.


Figures
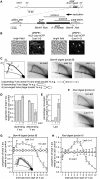
Figure 1.
Figure 1.
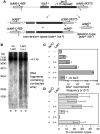
A lacO-LacI array is an effective RFB in eukaryotes. (A) Schematic showing the position of the ade6- direct repeat and lacO array on chromosome 3 as well as the probes used for the 2D gel analysis in C and F. (B) Images showing (+) and (++) levels of NLS-LacI-eCFP in cells containing the lacO array. The arrowhead indicates an example of a lacO-LacI focus. Cells were analysed after 20 h of LacI induction. (C) Two-dimensional gel analysis of replication intermediates in the BamHI lacO-containing fragment from a wild-type strain with the indicated amount of LacI. Note that the shadow behind the Y-arc is due to shearing of DNA during sample preparation, and, in the case of LacI (++), also contraction of the lacO array (see also Figure 2B). (D and E) Quantification of data like in (C). The data are mean values from three independent experiments. Error bars represent standard deviations. (F) Two-dimensional gel analysis of replication intermediates in the XbaI lacO-containing fragment from a wild-type strain with the indicated amount of LacI. (G and H) Quantification of data like in (C) and (F). The diagram inset in (G) shows the regions of the Y-arc that were quantified. The data are mean values from three or four independent experiments. Error bars represent standard deviations.
Figure 2.
Figure 2.
Direct repeat recombination in strains containing a lacO-LacI array. (A) Schematic showing the ade6 direct repeat and lacO array on chromosome 3 and the two classes of Ade+ recombinant. Asterisks indicate the position of the point mutations in ade6-L469 and ade6-M375. (B) Neutral gel analysis of the XbaI lacO-containing fragment (see Figure 1A) from strain MCW1998 containing either pREP41 (LacI −) or pREP41-NLS-LacI-eCFP (LacI ++). Cells were grown for ∼20 h in the absence of thiamine prior to DNA extraction in agarose plugs. The Southern blot is probed with probe A (see Figure 1A). Lanes a and b, and c and d contain duplicate samples. (C) Ade+ recombinant frequencies in wild-type strains with and without the lacO array and LacI as indicated. (D) The percentage of Ade+ recombinants in C that are conversion-types. In all cases error bars are the standard deviations about the mean (see also Supplementary Table S1).
Figure 3.
Figure 3.
Genetic requirements for lacO-LacI-induced direct repeat recombination. (A) Ade+ recombinant frequencies in lacO array-containing strains expressing LacI (+). (B) The percentage of Ade+ recombinants in A that are conversion-types. (C) Ade+ recombinant frequencies in lacO array-containing strains expressing LacI (++). (D) The percentage of Ade+ recombinants in C that are conversion-types. In all cases error bars are the standard deviations about the mean (see also Supplementary Table S1 and Supplementary Figure S1).
Figure 4.
Figure 4.
Detection of DSBs caused by the lacO-LacI array. (A) Schematic of chromosome 3 showing the position of the ade6 locus and probes used for the Southern blot analysis of the CHEF gel in (B). (B) Detection of DSBs by whole chromosome CHEF analysis. The DNA in lanes a–f and i–n are from strains containing the lacO array with and without LacI (++) expression. The DNA in lanes g, h, o and p are from a strain that contains a MATa cleavage site in place of the lacO array and either pREP81 (HO −) or pACYCREP81-HO (HO +). Cultures were grown in EMMG lacking leucine, histidine and thiamine at 30°C for 20 h (lacO array strains) or 24 h (MATa strains) before isolating genomic DNA in agarose plugs. (C) Schematic showing the position of the lacO array relative to AvrII sites flanking the ade6 locus and the probe used for the Southern blot analysis of the CHEF gel in (D). (D) CHEF analysis of AvrII digested genomic DNA from strains with and without LacI (++) expression. (E) Viability of strains relative to minus LacI control after 24 h of LacI (++) induction. (F) The percentage of viable colonies in E that are Ade+. In both (E) and (F) the error bars are the standard deviations about the mean.
Figure 5.
Figure 5.
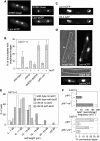
lacO-LacI induces UFB formation. (A) Examples of UFBs in wild-type cells with the lacO array after 24 h of LacI (++) induction. (B) Quantification of the percentage of dividing cells with UFBs in wild-type and mutant strains with and without the lacO array after 24 h of LacI (++) induction. Mean values are from at least three independent experiments with ≥100 binucleate cells scored in each experiment. Error bars are the standard deviations. (C) Example showing localization of Histone H3.2-GFP to a UFB. (D, top panel) Example of cell with a UFB in which a division septum (indicated by the arrowhead) is in the process of forming. (D, bottom panel) Example of a cell in which a division septum has formed and appeared to have broken a UFB. (E) The distribution of cell lengths in asynchronously growing populations of wild-type and chk1Δ strains with and without the lacO array after 24 h of LacI (++) induction (n ≥ 300). (F) Ade+ recombinant frequencies (top panel) and percentage of Ade+ recombinants that are conversion-types (bottom panel) in lacO array-containing strains expressing LacI (+). Error bars are the standard deviations about the mean.
Figure 6.
Figure 6.
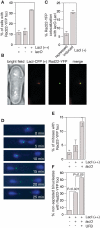
Rad22-YFP foci are induced by the lacO-LacI RFB. (A) Rad22-YFP foci in strains with and without the lacO array with and without LacI (++) induction for 24 h. The data are mean values from three independent experiments with ≥100 cells assessed for foci in each experiment. Error bars represent standard deviations. (B) Example of Rad22-YFP focus co-localizing with lacO-LacI (+). (C) Co-localization of Rad22-YFP foci with the lacO array in the presence of repressed and induced levels of LacI (+). A total of between 200 and 300 Rad22-YFP foci-positive cells were assessed for co-localization in three independent experiments. The error bars are the standard deviations about the mean. (D) Images from time-lapse microscopy of Rad22-YFP foci (green) in a lacO array-containing cell undergoing anaphase after 24 h of LacI-eCFP (++) (blue) induction. (E) A comparison of the percentage of cells with and without lacO/LacI (++) that undergo mitosis with one or two Rad22-YFP foci present throughout. The data are means from three independent experiments with ∼50–100 time-lapse movies of cells undergoing mitosis assessed in each experiment. Error bars represent standard deviations. (F) A comparison of the percentage of non-septated binucleate cells with and without a lacO array and with and without a UFB (each n = 50) that contain at least one Rad22-YFP focus after 24 h of LacI (++) induction. P-values were calculated by Fisher's exact test (two-tailed).
Figure 7.
Figure 7.
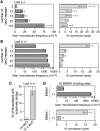
The effect of array length and type on recombinant frequency and UFB formation. (A) Ade+ recombinant frequencies and percentage conversion-types in strains with different length lacO arrays and LacI (+) induction. (B) The same as in (A) but with LacI (++) induction. (C) The percentage of dividing cells with UFBs in a strain with a 12xlacO array after 24 h of LacI (++) induction. (D) Ade+ recombinant frequencies and percentage conversion-types in strains with a 10xFR array with and without EBNA1 induction. In all cases error bars are the standard deviations about the mean.

Similar articles

Cited by

References

    1. McGlynn P, Lloyd RG. Recombinational repair and restart of damaged replication forks. Nat. Rev. Mol. Cell. Biol. 2002;3:859–870. - PubMed
    1. Rothstein R, Michel B, Gangloff S. Replication fork pausing and recombination or “gimme a break”. Genes Dev. 2000;14:1–10. - PubMed
    1. Branzei D, Foiani M. Interplay of replication checkpoints and repair proteins at stalled replication forks. DNA Repair. 2007;6:994–1003. - PubMed
    1. Branzei D, Foiani M. Maintaining genome stability at the replication fork. Nat. Rev. Mol. Cell. Biol. 2010;11:208–219. - PubMed
    1. Lambert S, Mizuno K, Blaisonneau J, Martineau S, Chanet R, Freon K, Murray JM, Carr AM, Baldacci G. Homologous recombination restarts blocked replication forks at the expense of genome rearrangements by template exchange. Mol. Cell. 2010;39:346–359. - PubMed

Publication types