Review
. 2011:101:161-80.
doi: 10.1016/B978-0-12-387036-0.00007-4.

A guide to analysis of cardiac phenotypes in the zebrafish embryo

Affiliations
Review

A guide to analysis of cardiac phenotypes in the zebrafish embryo

Grant I Miura et al. Methods Cell Biol. 2011.

Abstract

The zebrafish is an ideal model organism for investigating the molecular mechanisms underlying cardiogenesis, due to the powerful combination of optical access to the embryonic heart and plentiful opportunities for genetic analysis. A continually increasing number of studies are uncovering mutations, morpholinos, and small molecules that cause striking cardiac defects and disrupt blood circulation in the zebrafish embryo. Such defects can result from a wide variety of origins including defects in the specification or differentiation of cardiac progenitor cells; errors in the morphogenesis of the heart tube, the cardiac chambers, or the atrioventricular canal or problems with establishing proper cardiac function. An extensive arsenal of techniques is available to distinguish between these possibilities and thereby decipher the roots of cardiac defects. In this chapter, we provide a guide to the experimental strategies that are particularly effective for the characterization of cardiac phenotypes in the zebrafish embryo.


Figures

Fig. 1
Fig. 1
Phases of heart formation in the zebrafish embryo. (A) Schematic lateral view, dorsal to the right, of the late blastula. Ventricular (red) and atrial (yellow) myocardial progenitor cells are spatially organized within bilateral marginal zones at this stage. (B–D) Schematic dorsal views, anterior up, depicting the locations of ventricular (red) and atrial (yellow) cardiomyocytes during cardiac morphogenesis. (B) Myocardial progenitors migrate to form bilateral heart fields within the ALPM. (C) The process of cardiac fusion recruits cardiomyocytes to the embryonic midline, where they form a cardiac cone. (D) Continued migration of cardiomyocytes elongates the cardiac cone to create the heart tube. (E) Schematic frontal view, anterior up, depicting the morphologically distinct ventricle (red) and atrium (yellow) that are separated by a constriction at the atrioventricular canal following chamber emergence. Adapted from Schoenebeck and Yelon (2007).
Fig. 2
Fig. 2
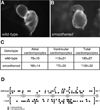
Hedgehog signaling promotes the specification of myocardial progenitor cells. (A, B) Lateral views of wild-type (A) and smoothened mutant (B) hearts at 48 hpf. Immunofluorescence with MF20 and S46 antibodies allows visualization of the ventricle (red) and atrium (yellow), both of which are misshapen in smoothened mutants. (C) Quantification of cardiomyocyte number at 52 hpf in wild-type and smoothened mutant hearts. Values represent the mean cell number (± standard deviation) for each category, and asterisks indicate statistically significant differences from wild type. (D) Fate maps of myocardial progenitors at 40% epiboly in wild-type and cyclopamine-treated embryos. Longitude coordinates of the first tier of the embryonic margin are depicted with dorsal as the origin (0°) and ventral as 180°. Each dot represents an individual labeling experiment. Red dots represent embryos in which labeled blastomeres contributed to ventricular myocardium, and black dots represent embryos in which the labeled cells did not become cardiomyocytes. Adapted from Thomas et al. (2008).
Fig. 3
Fig. 3
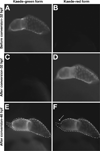
Photoconversion of Kaede provides an assay for the timing of cardiomyocyte differentiation. Lateral views of Tg(cmlc2:kaede) embryos, ventricle to the left. (A, B) Prior to photoconversion, the heart exhibits green, but not red, Kaede fluorescence. (C, D) After photoconversion, green Kaede fluorescence has been converted into red Kaede fluorescence. (E, F) Sixteen hours later, red Kaede fluorescence persists in the cells that were expressing Tg(cmlc2:kaede) at 32 hpf. These cells also contain newly generated green Kaede fluorescence. In contrast, newly differentiated cells in the outflow tract at the arterial pole (arrow) exhibit only green, and not red, Kaede fluorescence. Adapted from de Pater et al. (2009).
Fig. 4
Fig. 4
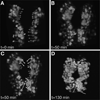
Tracking the paths of individual cardiomyocytes during cardiac fusion. Selected images from a time-lapse of cardiac fusion in a wild-type embryo expressing Tg(cmlc2:egfp) between the 16 and 20 somite stages; dorsal views, anterior to the top. Arrows indicate paths traveled by individual cells from their starting positions (A, C) to their ending positions (B, D). Red arrows indicate medial movement, and yellow arrows indicate angular movement. (A, B) Cardiac fusion initiates with medial movement toward the midline. (C, D) Cardiomyocytes in anterior and posterior regions and then transition into angular patterns of movement that create the cardiac cone. Adapted from Holtzman et al. (2007).
Fig. 5
Fig. 5
Patterns of cardiomyocyte movement during heart tube elongation. (A) Selected images from a time-lapse of heart tube elongation in a wild-type embryo expressing Tg(cmlc2:egfp) beginning at the 23-somite stage; dorsal views, anterior to the top. The cardiac cone was divided into four regions (I–IV), and the movements of individual cardiomyocytes from each region were tracked. (B) Bar graphs indicate the mean displacement rate and meandering index for tracked cardiomyocytes; error bars indicate standard errors. Comparisons of the displacement rate (displacement/time) and meandering index (displacement/track length) for each quadrant indicate that posterior cardiomyocytes exhibit higher rates of displacement than anterior cardiomyocytes, whereas the meandering index is comparable for each subset of cardiomyocytes. Adapted from Smith et al. (2008).
Fig. 6
Fig. 6
Regionally confined cell shape changes underlie the emergence of chamber curvatures. (A–C) Confocal projections of live hearts expressing Tg(cmlc2:egfp) with mosaic expression of Tg(cmlc2:dsRed). Arrows point to representative cells expressing both dsRed and egfp. Ventricular cells in the LHTat 28 hpf (A) and in the IC at 52 hpf (C) are relatively cuboidal, whereas cells in the OC at 52 hpf (B) are flattened and elongated. (D, E) Bar graphs indicate the mean surface area and circularity index of cells in the LHT, IC, and OC. Error bars indicate standard error, and asterisks indicate statistically significant differences from LHT values. OC cells exhibit an increase in surface area with an accompanying decrease in circularity. Adapted from Auman et al. (2007).
Fig. 7
Fig. 7
Time-lapse imaging of atrioventricular valve function during development. Selected images from SPIM analysis of embryos expressing Tg(flk1:egfp) and Tg(gata1:dsRed) at 55 hpf (A–C) and 72 hpf (D–F), with accompanying schematics. (A–C) At 55 hpf, the AVC initially closes as a consequence of myocardial contraction (A), then closes further through a rolling motion (B), and finally relaxes in order to reopen (C). (D–F) Similar motions take place at 72 hpf, but the increased thickness of the AVC endocardium occludes the lumen and prevents retrograde blood flow during the steps of rolling and relaxation. Adapted from Scherz et al. (2008).
Fig. 8
Fig. 8
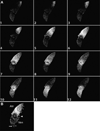
Optical mapping of cardiac conduction. (A) Sequence of images depicts calcium activation initiating in the sinus venosus (top) and concluding in the ventricle (bottom) of a live heart expressing Tg (cmlc2:gCaMP) at 48 hpf. (B) Optical map of the pattern of calcium excitation shown in (A); isochronal lines represent every 60 ms. Images 5–10 (A) and isochronal lines 5–10 (B) indicate conduction delay at the AVC. Adapted from Chi et al. (2008).

Similar articles

Cited by

References

    1. Alexander J, Stainier DY, Yelon D. Screening mosaic F1 females for mutations affecting zebrafish heart induction and patterning. Dev. Genet. 1998;22:288–299. - PubMed
    1. Alexander J, Rothenberg M, Henry GL, Stainier DY. casanova plays an early and essential role in endoderm formation in zebrafish. Dev. Biol. 1999;215:343–357. - PubMed
    1. Arrington CB, Yost HJ. Extra-embryonic syndecan 2 regulates organ primordia migration and fibrillogenesis throughout the zebrafish embryo. Development. 2009;136:3143–3152. - PMC - PubMed
    1. Auman HJ, Coleman H, Riley HE, Olale F, Tsai HJ, Yelon D. Functional modulation of cardiac form through regionally confined cell shape changes. PLoS Biol. 2007;5:e53. - PMC - PubMed
    1. Baird GS, Zacharias DA, Tsien RY. Biochemistry, mutagenesis, and oligomerization of DsRed, a red fluorescent protein from coral. Proc. Natl. Acad. Sci. U.S.A. 2000;97:11984–11989. - PMC - PubMed

LinkOut - more resources