

Transient receptor potential mucolipin 1 (TRPML1) and two-pore channels are functionally independent organellar ion channels
- PMID: 21540176
- PMCID: PMC3123061
- DOI: 10.1074/jbc.M110.210930
Transient receptor potential mucolipin 1 (TRPML1) and two-pore channels are functionally independent organellar ion channels
Abstract
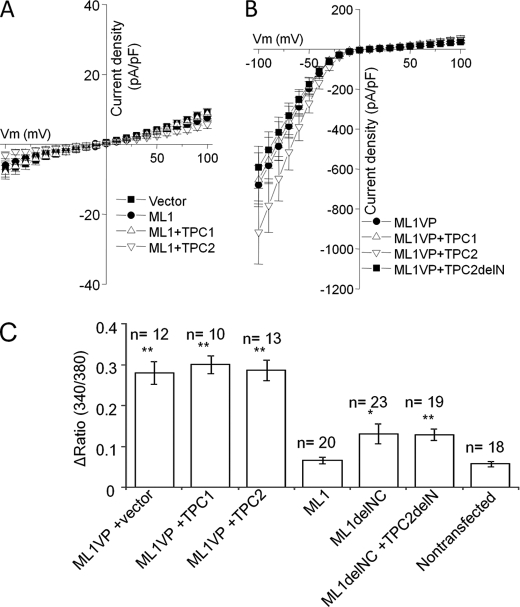
NAADP is a potent second messenger that mobilizes Ca(2+) from acidic organelles such as endosomes and lysosomes. The molecular basis for Ca(2+) release by NAADP, however, is uncertain. TRP mucolipins (TRPMLs) and two-pore channels (TPCs) are Ca(2+)-permeable ion channels present within the endolysosomal system. Both have been proposed as targets for NAADP. In the present study, we probed possible physical and functional association of these ion channels. Exogenously expressed TRPML1 showed near complete colocalization with TPC2 and partial colocalization with TPC1. TRPML3 overlap with TPC2 was more modest. TRPML1 and to some extent TRPML3 co-immunoprecipitated with TPC2 but less so with TPC1. Current recording, however, showed that TPC1 and TPC2 did not affect the activity of wild-type TRPML1 or constitutively active TRPML1(V432P). N-terminally truncated TPC2 (TPC2delN), which is targeted to the plasma membrane, also failed to affect TRPML1 and TRPML1(V432P) channel function or TRPML1(V432P)-mediated Ca(2+) influx. Whereas overexpression of TPCs enhanced NAADP-mediated Ca(2+) signals, overexpression of TRPML1 did not, and the dominant negative TRPML1(D471K) was without affect on endogenous NAADP-mediated Ca(2+) signals. Furthermore, the single channel properties of NAADP-activated TPC2delN were not affected by TRPML1. Finally, NAADP-evoked Ca(2+) oscillations in pancreatic acinar cells were identical in wild-type and TRPML1(-/-) cells. We conclude that although TRPML1 and TPCs are present in the same complex, they function as two independent organellar ion channels and that TPCs, not TRPMLs, are the targets for NAADP.
Figures


Similar articles
-
Both RyRs and TPCs are required for NAADP-induced intracellular Ca²⁺ release.Cell Calcium. 2015 Sep;58(3):237-45. doi: 10.1016/j.ceca.2015.05.005. Epub 2015 Jun 10. Cell Calcium. 2015. PMID: 26100948 Free PMC article.
-
Lsm12 is an NAADP receptor and a two-pore channel regulatory protein required for calcium mobilization from acidic organelles.Nat Commun. 2021 Aug 6;12(1):4739. doi: 10.1038/s41467-021-24735-z. Nat Commun. 2021. PMID: 34362892 Free PMC article.
-
Role of TRPML and two-pore channels in endolysosomal cation homeostasis.J Pharmacol Exp Ther. 2012 Aug;342(2):236-44. doi: 10.1124/jpet.112.192880. Epub 2012 Apr 19. J Pharmacol Exp Ther. 2012. PMID: 22518024
-
Activation of endo-lysosomal two-pore channels by NAADP and PI(3,5)P2. Five things to know.Cell Calcium. 2022 May;103:102543. doi: 10.1016/j.ceca.2022.102543. Epub 2022 Jan 25. Cell Calcium. 2022. PMID: 35123238 Free PMC article. Review.
-
Calcium signaling via two-pore channels: local or global, that is the question.Am J Physiol Cell Physiol. 2010 Mar;298(3):C430-41. doi: 10.1152/ajpcell.00475.2009. Epub 2009 Dec 16. Am J Physiol Cell Physiol. 2010. PMID: 20018950 Free PMC article. Review.
Cited by
-
Preferential Coupling of the NAADP Pathway to Exocytosis in T-Cells.Messenger (Los Angel). 2015 Jun;4(1):53-66. doi: 10.1166/msr.2015.1040. Messenger (Los Angel). 2015. PMID: 27330870 Free PMC article.
-
Two-pore channels form homo- and heterodimers.J Biol Chem. 2011 Oct 28;286(43):37058-62. doi: 10.1074/jbc.C111.289835. Epub 2011 Sep 8. J Biol Chem. 2011. PMID: 21903581 Free PMC article.
-
Tuning the ion selectivity of two-pore channels.Proc Natl Acad Sci U S A. 2017 Jan 31;114(5):1009-1014. doi: 10.1073/pnas.1616191114. Epub 2017 Jan 17. Proc Natl Acad Sci U S A. 2017. PMID: 28096396 Free PMC article.
-
Endo-lysosomal TRP mucolipin-1 channels trigger global ER Ca2+ release and Ca2+ influx.J Cell Sci. 2016 Oct 15;129(20):3859-3867. doi: 10.1242/jcs.190322. Epub 2016 Aug 30. J Cell Sci. 2016. PMID: 27577094 Free PMC article.
-
Mitochondrial function and malfunction in the pathophysiology of pancreatitis.Pflugers Arch. 2012 Jul;464(1):89-99. doi: 10.1007/s00424-012-1117-8. Epub 2012 Jun 1. Pflugers Arch. 2012. PMID: 22653502 Review.
References
Publication types
MeSH terms
Substances
Grants and funding
LinkOut - more resources
Full Text Sources
Molecular Biology Databases
Miscellaneous
