

Docking, not fusion, as the rate-limiting step in a SNARE-driven vesicle fusion assay
- PMID: 21539781
- PMCID: PMC3149229
- DOI: 10.1016/j.bpj.2011.03.015
Docking, not fusion, as the rate-limiting step in a SNARE-driven vesicle fusion assay
Abstract
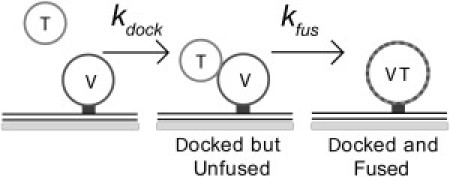
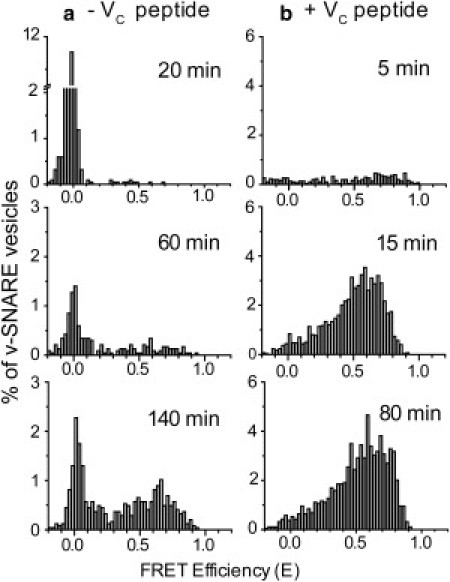
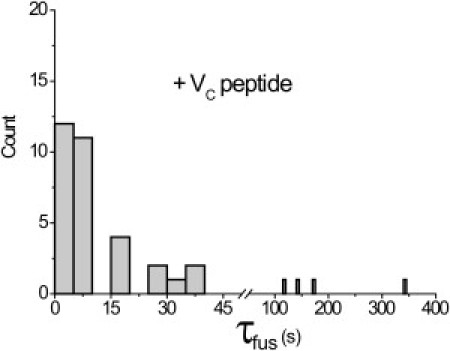
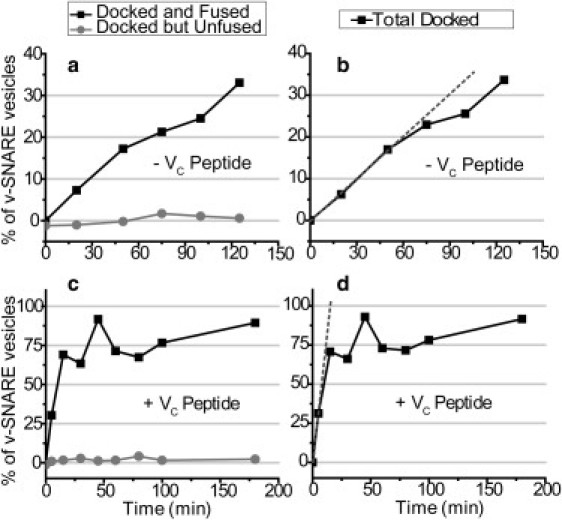
In vitro vesicle fusion assays that monitor lipid mixing between t-SNARE and v-SNARE vesicles in bulk solution exhibit remarkably slow fusion on the nonphysiological timescale of tens of minutes to several hours. Here, single-vesicle, fluorescence resonance energy transfer-based assays cleanly separate docking and fusion steps for individual vesicle pairs containing full-length SNAREs. Docking is extremely inefficient and is the rate-limiting step. Of importance, the docking and fusion kinetics are comparable in the two assays (one with v-SNARE vesicles tethered to a surface and the other with v-SNARE vesicles free in solution). Addition of the V(C) peptide synaptobrevin-2 (syb(57-92)) increases the docking efficiency by a factor of ∼30, but docking remains rate-limiting. In the presence of V(C) peptide, the fusion step occurs on a timescale of ∼10 s. In previous experiments involving bulk fusion assays in which the addition of synaptotagmin/Ca(2+), Munc-18, or complexin accelerated the observed lipid-mixing rate, the enhancement may have arisen from the docking step rather than the fusion step.
Copyright © 2011 Biophysical Society. Published by Elsevier Inc. All rights reserved.
Figures

Similar articles
-
Solution single-vesicle assay reveals PIP2-mediated sequential actions of synaptotagmin-1 on SNAREs.EMBO J. 2012 May 2;31(9):2144-55. doi: 10.1038/emboj.2012.57. Epub 2012 Mar 9. EMBO J. 2012. PMID: 22407297 Free PMC article.
-
Single vesicle assaying of SNARE-synaptotagmin-driven fusion reveals fast and slow modes of both docking and fusion and intrasample heterogeneity.Biophys J. 2011 Feb 16;100(4):957-67. doi: 10.1016/j.bpj.2010.12.3730. Biophys J. 2011. PMID: 21320440 Free PMC article.
-
In vitro assays to measure SNARE-mediated vesicle fusion.Methods Mol Biol. 2008;440:37-50. doi: 10.1007/978-1-59745-178-9_3. Methods Mol Biol. 2008. PMID: 18369935
-
In vitro single vesicle fusion assays based on pore-spanning membranes: merits and drawbacks.Eur Biophys J. 2021 Mar;50(2):239-252. doi: 10.1007/s00249-020-01479-0. Epub 2020 Dec 15. Eur Biophys J. 2021. PMID: 33320298 Free PMC article. Review.
-
Single-molecule studies of the neuronal SNARE fusion machinery.Annu Rev Biochem. 2009;78:903-28. doi: 10.1146/annurev.biochem.77.070306.103621. Annu Rev Biochem. 2009. PMID: 19489736 Free PMC article. Review.
Cited by
-
A single vesicle-vesicle fusion assay for in vitro studies of SNAREs and accessory proteins.Nat Protoc. 2012 May;7(5):921-34. doi: 10.1038/nprot.2012.020. Nat Protoc. 2012. PMID: 22582418 Free PMC article.
-
A distinct tethering step is vital for vacuole membrane fusion.Elife. 2014 Sep 25;3:e03251. doi: 10.7554/eLife.03251. Elife. 2014. PMID: 25255215 Free PMC article.
-
Solution single-vesicle assay reveals PIP2-mediated sequential actions of synaptotagmin-1 on SNAREs.EMBO J. 2012 May 2;31(9):2144-55. doi: 10.1038/emboj.2012.57. Epub 2012 Mar 9. EMBO J. 2012. PMID: 22407297 Free PMC article.
-
Highly Efficient Protein-free Membrane Fusion: A Giant Vesicle Study.Biophys J. 2019 Jan 8;116(1):79-91. doi: 10.1016/j.bpj.2018.11.3128. Epub 2018 Dec 1. Biophys J. 2019. PMID: 30579564 Free PMC article.
-
SNARE proteins: one to fuse and three to keep the nascent fusion pore open.Science. 2012 Mar 16;335(6074):1355-9. doi: 10.1126/science.1214984. Science. 2012. PMID: 22422984 Free PMC article.
References
-
- Sutton R.B., Fasshauer D., Brunger A.T. Crystal structure of a SNARE complex involved in synaptic exocytosis at 2.4 A resolution. Nature. 1998;395:347–353. - PubMed
-
- Fasshauer D., Antonin W., Jahn R. SNARE assembly and disassembly exhibit a pronounced hysteresis. Nat. Struct. Biol. 2002;9:144–151. - PubMed
-
- McNew J.A. Regulation of SNARE-mediated membrane fusion during exocytosis. Chem. Rev. 2008;108:1669–1686. - PubMed
Publication types
MeSH terms
Substances
Grants and funding
LinkOut - more resources
Full Text Sources
