Haploid insufficiency of suppressor enhancer Lin12 1-like (SEL1L) protein predisposes mice to high fat diet-induced hyperglycemia
- PMID: 21536682
- PMCID: PMC3121373
- DOI: 10.1074/jbc.M111.239418
Haploid insufficiency of suppressor enhancer Lin12 1-like (SEL1L) protein predisposes mice to high fat diet-induced hyperglycemia
Abstract
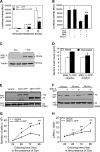
Increasing evidence suggests that endoplasmic reticulum (ER) stress plays an important role in the pathogenesis of type 2 diabetes mellitus. SEL1L is an ER membrane protein that is highly expressed in the pancreatic islet and acinar cells. We have recently reported that a deficiency of SEL1L causes systemic ER stress and leads to embryonic lethality in mice. Here we show that mice with one functional allele of Sel1l (Sel1l(+/-)) are more susceptible to high fat diet (HFD)-induced hyperglycemia. Sel1l(+/-) mice have a markedly reduced β-cell mass as a result of decreased β-cell proliferation. Consequently, Sel1l(+/-) mice are severely glucose-intolerant and exhibit significantly retarded glucose-stimulated insulin secretion. Pancreatic islets from Sel1l(+/-) mice stimulated with a high concentration of glucose in vitro express significantly higher levels of unfolded protein response genes than those from wild-type control mice. Furthermore, dominant-negative interference of SEL1L function in insulinoma cell lines severely impairs, whereas overexpression of SEL1L efficiently improves protein secretion. Taken together, our results indicate that haploid insufficiency of SEL1L predispose mice to high fat diet-induced hyperglycemia. Our findings highlight a critical and previously unknown function for SEL1L in regulating adult β-cell function and growth.
Figures


Similar articles
-
Deficiency of suppressor enhancer Lin12 1 like (SEL1L) in mice leads to systemic endoplasmic reticulum stress and embryonic lethality.J Biol Chem. 2010 Apr 30;285(18):13694-703. doi: 10.1074/jbc.M109.085340. Epub 2010 Mar 2. J Biol Chem. 2010. PMID: 20197277 Free PMC article.
-
Endoplasmic Reticulum-Associated Degradation (ERAD) Has a Critical Role in Supporting Glucose-Stimulated Insulin Secretion in Pancreatic β-Cells.Diabetes. 2019 Apr;68(4):733-746. doi: 10.2337/db18-0624. Epub 2019 Jan 9. Diabetes. 2019. PMID: 30626610
-
Characterization of pancreatic islets in two selectively bred mouse lines with different susceptibilities to high-fat diet-induced glucose intolerance.PLoS One. 2014 Jan 13;9(1):e84725. doi: 10.1371/journal.pone.0084725. eCollection 2014. PLoS One. 2014. PMID: 24454742 Free PMC article.
-
Taurine supplementation prevents morpho-physiological alterations in high-fat diet mice pancreatic β-cells.Amino Acids. 2012 Oct;43(4):1791-801. doi: 10.1007/s00726-012-1263-5. Epub 2012 Mar 15. Amino Acids. 2012. PMID: 22418865
-
Deletion of GαZ protein protects against diet-induced glucose intolerance via expansion of β-cell mass.J Biol Chem. 2012 Jun 8;287(24):20344-55. doi: 10.1074/jbc.M112.359745. Epub 2012 Mar 28. J Biol Chem. 2012. PMID: 22457354 Free PMC article.
Cited by
-
Conserved cytoplasmic domains promote Hrd1 ubiquitin ligase complex formation for ER-associated degradation (ERAD).J Cell Sci. 2017 Oct 1;130(19):3322-3335. doi: 10.1242/jcs.206847. Epub 2017 Aug 21. J Cell Sci. 2017. PMID: 28827405 Free PMC article.
-
SEL1L regulates adhesion, proliferation and secretion of insulin by affecting integrin signaling.PLoS One. 2013 Nov 20;8(11):e79458. doi: 10.1371/journal.pone.0079458. eCollection 2013. PLoS One. 2013. PMID: 24324549 Free PMC article.
-
Compensatory Islet Response to Insulin Resistance Revealed by Quantitative Proteomics.J Proteome Res. 2015 Aug 7;14(8):3111-3122. doi: 10.1021/acs.jproteome.5b00587. Epub 2015 Jul 30. J Proteome Res. 2015. PMID: 26151086 Free PMC article.
-
Dual Effect of Rosuvastatin on Glucose Homeostasis Through Improved Insulin Sensitivity and Reduced Insulin Secretion.EBioMedicine. 2016 Aug;10:185-94. doi: 10.1016/j.ebiom.2016.07.007. Epub 2016 Jul 9. EBioMedicine. 2016. PMID: 27453321 Free PMC article.
-
Phosphorylation and degradation of tomosyn-2 de-represses insulin secretion.J Biol Chem. 2014 Sep 5;289(36):25276-86. doi: 10.1074/jbc.M114.575985. Epub 2014 Jul 7. J Biol Chem. 2014. PMID: 25002582 Free PMC article.
References
-
- American Diabetes Association (2008) Diabetes Care 31, 596–615 - PubMed
-
- Butler A. E., Janson J., Bonner-Weir S., Ritzel R., Rizza R. A., Butler P. C. (2003) Diabetes 52, 102–110 - PubMed
-
- Carey D. G., Jenkins A. B., Campbell L. V., Freund J., Chisholm D. J. (1996) Diabetes 45, 633–638 - PubMed
-
- DeFronzo R. A., Bonadonna R. C., Ferrannini E. (1992) Diabetes Care 15, 318–368 - PubMed
-
- Eizirik D. L., Cardozo A. K., Cnop M. (2008) Endocr. Rev. 29, 42–61 - PubMed
Publication types
MeSH terms
Substances
Grants and funding
LinkOut - more resources
Full Text Sources
Medical
Molecular Biology Databases

