. 2011 Jul 1;286(26):22758-68.
doi: 10.1074/jbc.M111.235077. Epub 2011 May 2.

Cap-binding protein complex links pre-mRNA capping to transcription elongation and alternative splicing through positive transcription elongation factor b (P-TEFb)

Affiliations

Cap-binding protein complex links pre-mRNA capping to transcription elongation and alternative splicing through positive transcription elongation factor b (P-TEFb)

Tina Lenasi et al. J Biol Chem. .

Abstract

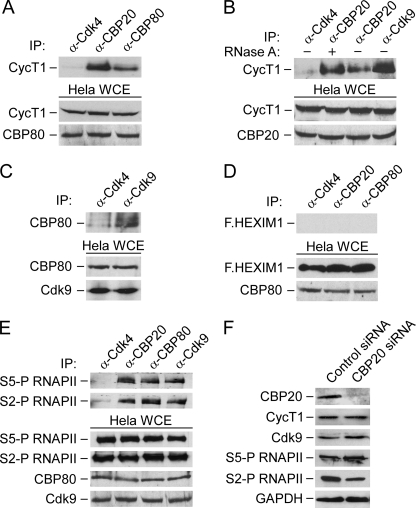
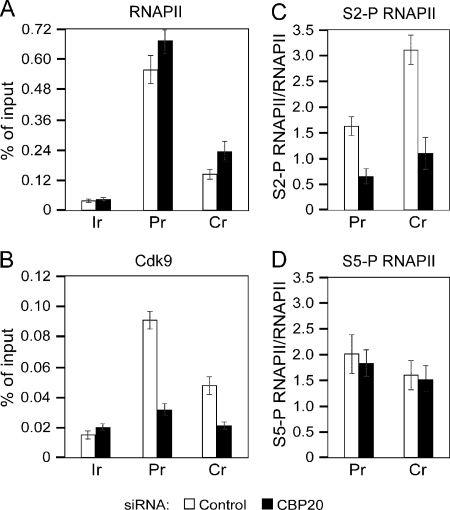
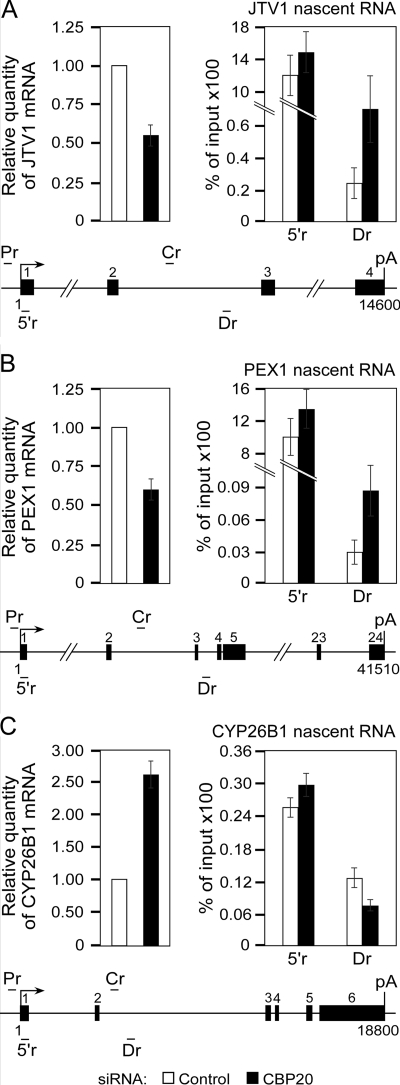
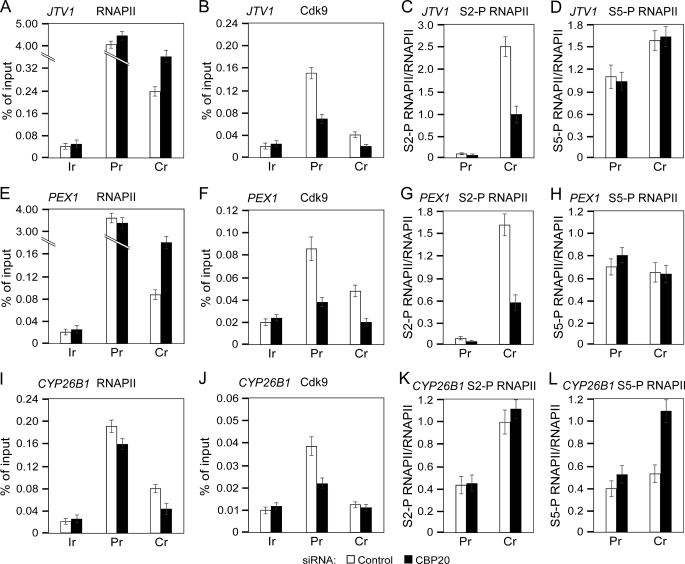
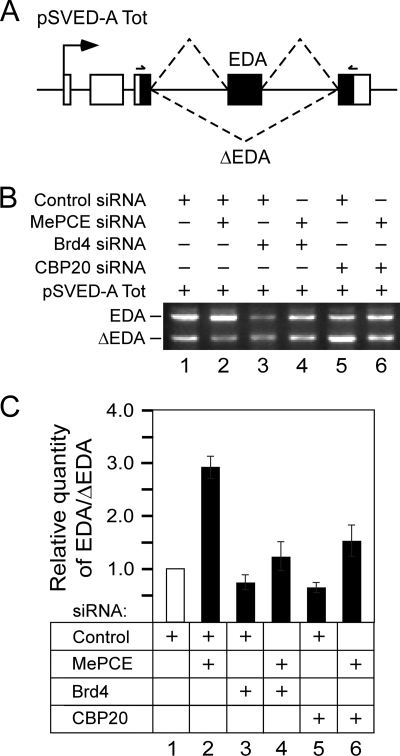
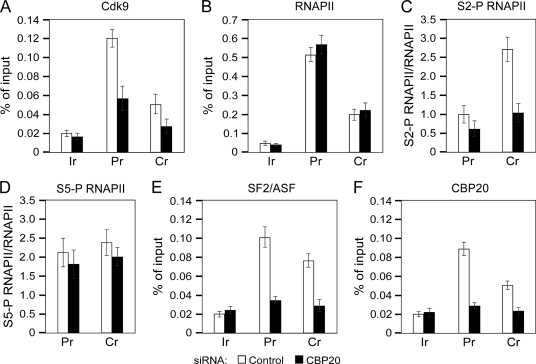
Promoter-proximal pausing of RNAPII coincides with the formation of the cap structure at the 5' end of pre-mRNA, which is bound by the cap-binding protein complex (CBC). Although the positive transcription elongation factor b (P-TEFb) stimulates the release of RNAPII from pausing and promotes transcription elongation and alternative splicing by phosphorylating the RNAPII C-terminal domain at Ser2 (S2-P RNAPII), it is unknown whether CBC facilitates these events. In this study, we report that CBC interacts with P-TEFb and transcriptionally engaged RNAPII and is globally required for optimal levels of S2-P RNAPII. Quantitative nascent RNA immunoprecipitation and ChIP experiments reveal that depletion of CBC attenuates HIV-1 Tat transactivation and impedes transcription elongation of investigated CBC-dependent endogenous genes by decreasing the levels of P-TEFb and S2-P RNAPII, leading to accumulation of RNAPII in the body of these genes. Finally, CBC is essential for the promotion of alternative splicing through facilitating P-TEFb, S2-P RNAPII, and splicing factor 2/alternative splicing factor occupancy at a splicing minigene. These findings disclose a vital role of CBC in connecting pre-mRNA capping to transcription elongation and alternative splicing via P-TEFb.


Figures

FIGURE 1.
FIGURE 1.
CBC and P-TEFb interact with each other as well as with S5-P and S2-P RNAPII, and depletion of CBC reduces total levels of S2-P RNAPII. A and B, WCEs of HeLa cells incubated (+) or not (−) with RNase A were subjected to immunoprecipitation (IP) with the indicated antibodies. Levels of CycT1 in immunoprecipitates (top) and those of CycT1 and CBP20 or CBP80 in WCEs (bottom) were detected by Western blotting. C, WCEs of HeLa cells were subjected to IP with the indicated antibodies. Levels of CBP80 in immunoprecipitates (top) and those of CBP80 and Cdk9 in WCEs (bottom) were detected by Western blotting. D, WCEs of HeLa cells expressing F.HEXIM1 were subjected to IP with the indicated antibodies. Levels of F.HEXIM1 in immunoprecipitates (top) and those of F.HEXIM1 and CBP80 in WCEs (bottom) were detected by Western blotting. E, WCEs of HeLa cells were subjected to IP with the indicated antibodies. Levels of S5-P RNAPII and S2-P RNAPII in immunoprecipitates (top) and those of S5-P RNAPII, S2-P RNAPII, CBP80, and Cdk9 in WCEs (bottom) were detected by Western blotting. F, levels of the indicated proteins in WCEs of HeLa cells treated with the control or CBP20 siRNA were detected by Western blotting.
FIGURE 2.
FIGURE 2.
Depletion of CBC abrogates Tat transactivation of the HIV-1 LTR CAT reporter gene and provokes accumulation of nascent transcripts within the body of the gene. A, relative quantity of CBP20 mRNA was determined by RT-qPCR using total RNA isolated from HL3T1 cells that expressed F.Tat and were treated with the control (white bars) or CBP20 siRNA (black bars). Absolute mRNA levels were normalized to GAPDH mRNA levels. B, CAT assay of WCEs of HL3T1 cells containing an integrated HIV-1 LTR CAT reporter gene is shown. Cells were treated with the control (white bars) or CBP20 siRNA (black bars) and expressed F.Tat as indicated below the CAT data. C, relative quantity of CAT mRNA was determined by RT-qPCR using total RNA samples isolated from HL3T1 cells that expressed F.Tat and were treated with the control (white bars) or CBP20 siRNA (black bars). Absolute CAT mRNA levels were normalized to the levels of transfected F.Tat gene. D, qNARIP was used to analyze HIV-1 LTR CAT nascent transcripts in HL3T1 cells expressing F.Tat. Cells were treated with the control (white bars) or CBP20 siRNA (black bars). Nascent mRNA was immunoprecipitated with the RNAPII antibody. Results are presented as percent of input DNA. Two different primer pairs were used for the amplification of transcripts at the 5′ region (5′r) or downstream region (Dr) as indicated below the schematic of the HIV-1 LTR CAT reporter gene. Arrow and pA depict transcription start site and polyadenylation signal, respectively. Primer pairs used for the amplification of DNA in ChIP-qPCR analysis (Fig. 3) at the promoter region (Pr) or coding region (Cr) are indicated above the gene schematic. Numbers below the schematic represent nucleotide positions of the gene in respect to the transcription start site. E, qNARIP was used to analyze HIV-1 nascent transcripts in HeLa expressing F.Tat and HIV-1 genome from pNL4–3 plasmid. Cells were treated with the control (white bars) or CBP20 siRNA (black bars). Nascent mRNA was immunoprecipitated with the RNAPII antibody. Results are presented as percent of input DNA. Four different primer pairs were used for the amplification of transcripts at the 5′ region (5′r) or downstream regions (Dr1, Dr2, and Dr3) as indicated below the schematic of the HIV-1 genome. Arrow and pA depict transcription start site and polyadenylation signal, respectively. Numbers below the schematic represent nucleotide positions of the gene in respect to the transcription start site.
FIGURE 3.
FIGURE 3.
Depletion of CBC leads to accumulation of RNAPII within the body of HIV-1 LTR CAT reporter gene and reduces the levels of Cdk9 and S2-P RNAPII at the promoter and coding region of the gene. ChIP-qPCR analysis was performed at the promoter (Pr) and coding region (Cr) of the HIV-1 LTR CAT gene and at the intergenic region (Ir) of the α-actin gene in HL3T1 cells expressing F.Tat. Cells were treated with the control (white bars) or CBP20 siRNA (black bars), and chromatin was immunoprecipitated with antibodies against the proteins indicated above the graphs. Results are presented as percent of input DNA or relative to the levels of total RNAPII as indicated.
FIGURE 4.
FIGURE 4.
Depletion of CBC results in accumulation of RNAPII-associated nascent RNA within the body of CBC-down-regulated endogenous genes. Left, relative quantities of JTV1, PEX1, and CYP26B1 mRNAs were determined by RT-qPCR using total RNA samples isolated from HeLa cells that were treated with the control (white bars) or CBP20 siRNA (black bars). Right, qNARIP analysis of JTV1, PEX1, or CYP26B1 nascent transcripts in HeLa cells. Cells were treated with the control (white bars) or CBP20 siRNA (black bars). Nascent mRNA was immunoprecipitated with the RNAPII antibody. Results are presented as percent of input DNA. Two different primer pairs were used for the amplification of transcripts at the 5′ region (5′r) or downstream region (Dr) as indicated below the schematic of each gene. Arrow and pA depict transcription start site and polyadenylation signal, respectively. Exons are numbered and represented with black rectangles. Primer pairs used for the amplification of DNA in ChIP-qPCR analysis (Fig. 5) at the promoter region (Pr) or coding region (Cr) are indicated above each gene schematic. Numbers below each schematic represent nucleotide positions of the gene in respect to the transcription start site.
FIGURE 5.
FIGURE 5.
Depletion of CBC leads to accumulation of RNAPII within the body of CBC-down-regulated endogenous genes and reduces the occupancy of Cdk9 and S2-P RNAPII at the promoter and coding region of these genes. ChIP-qPCR analysis was performed at the promoter (Pr) and coding region (Cr) of the indicated endogenous genes and at the intergenic region (Ir) of the α-actin gene in HeLa cells expressing the control (white bars) or CBP20 siRNA (black bars). Chromatin was immunoprecipitated with antibodies against the proteins indicated above the graphs. Results are presented as percent of input DNA or relative to the levels of total RNAPII as indicated.
FIGURE 6.
FIGURE 6.
CBC is necessary for P-TEFb-dependent stimulation of alternative EDA exon inclusion. A, schematic of the pSVED-A Tot minigene. Arrow represents the transcription start site from the α-globin promoter. The third exon of the three α-globin exons (white rectangles) contains three fibronectin exons (black rectangles; exons 32–34) with the accompanying introns (solid lines). Dashed lines represent the two possible mature EDA and ΔEDA mRNAs that include or lack the second fibronectin exon named EDA, respectively. The psv5′j/psv3′j primer pair used for RT-PCR analysis is indicated. B, levels of EDA and ΔEDA mRNAs detected by RT-PCR using total RNA isolated from HeLa cells that expressed pSVED-A Tot cassette and were treated with the siRNAs as indicated above the agarose gel. C, ratio between relative quantities of EDA versus ΔEDA mRNA determined by RT-qPCR using total RNA isolated from HeLa cells that expressed pSVED-A Tot cassette and were treated with the siRNAs as indicated below the graph.
FIGURE 7.
FIGURE 7.
Depletion of CBC reduces levels of Cdk9, S2-P RNAPII, and SF2/ASF at the pSVED-A Tot minigene. ChIP-qPCR analysis was performed at the promoter (Pr) and coding region (Cr) of pSVED-A Tot minigene and at the intergenic region (Ir) of the α-actin gene in HeLa cells. Cells were treated with the control (white bars) or CBP20 siRNA (black bars), and chromatin was immunoprecipitated with antibodies against the indicated proteins above the graphs. Results are presented as percent of input DNA or relative to RNAPII levels as indicated.

Similar articles

Cited by

References

    1. Perales R., Bentley D. (2009) Mol. Cell 36, 178–191 - PMC - PubMed
    1. Buratowski S. (2009) Mol. Cell 36, 541–546 - PMC - PubMed
    1. Egloff S., Murphy S. (2008) Trends Genet. 24, 280–288 - PubMed
    1. Akhtar M. S., Heidemann M., Tietjen J. R., Zhang D. W., Chapman R. D., Eick D., Ansari A. Z. (2009) Mol. Cell 34, 387–393 - PMC - PubMed
    1. Shuman S. (2001) Prog. Nucleic Acids Res. Mol. Biol. 66, 1–40 - PubMed

Publication types

MeSH terms

Substances