

DNA free energy-based promoter prediction and comparative analysis of Arabidopsis and rice genomes
- PMID: 21531900
- PMCID: PMC3135951
- DOI: 10.1104/pp.110.167809
DNA free energy-based promoter prediction and comparative analysis of Arabidopsis and rice genomes
Abstract
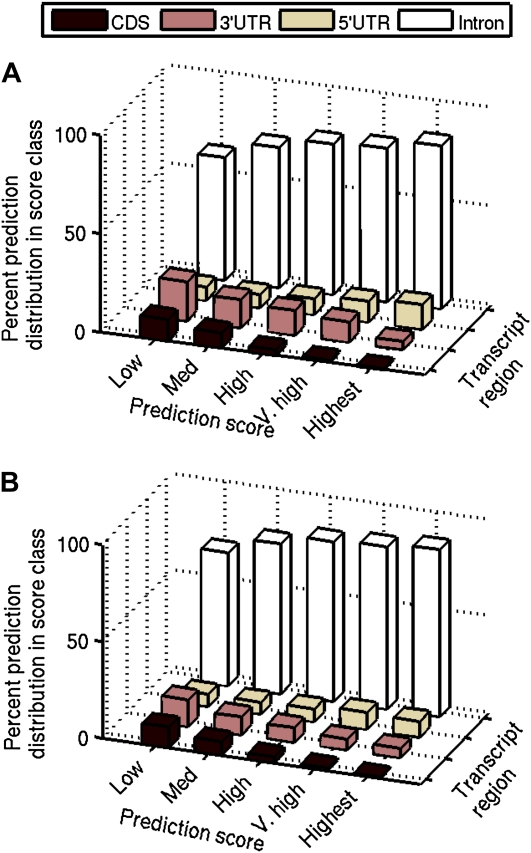
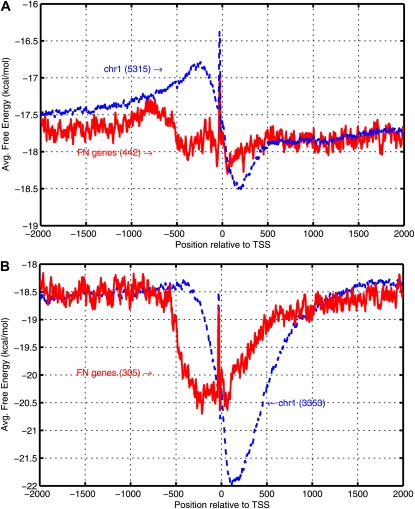
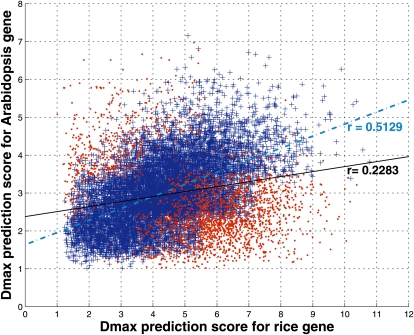
The cis-regulatory regions on DNA serve as binding sites for proteins such as transcription factors and RNA polymerase. The combinatorial interaction of these proteins plays a crucial role in transcription initiation, which is an important point of control in the regulation of gene expression. We present here an analysis of the performance of an in silico method for predicting cis-regulatory regions in the plant genomes of Arabidopsis (Arabidopsis thaliana) and rice (Oryza sativa) on the basis of free energy of DNA melting. For protein-coding genes, we achieve recall and precision of 96% and 42% for Arabidopsis and 97% and 31% for rice, respectively. For noncoding RNA genes, the program gives recall and precision of 94% and 75% for Arabidopsis and 95% and 90% for rice, respectively. Moreover, 96% of the false-positive predictions were located in noncoding regions of primary transcripts, out of which 20% were found in the first intron alone, indicating possible regulatory roles. The predictions for orthologous genes from the two genomes showed a good correlation with respect to prediction scores and promoter organization. Comparison of our results with an existing program for promoter prediction in plant genomes indicates that our method shows improved prediction capability.
Figures
Similar articles
-
Evolutionary expansion, gene structure, and expression of the rice wall-associated kinase gene family.Plant Physiol. 2005 Nov;139(3):1107-24. doi: 10.1104/pp.105.069005. Plant Physiol. 2005. PMID: 16286450 Free PMC article.
-
Distribution of short interstitial telomere motifs in two plant genomes: putative origin and function.BMC Plant Biol. 2010 Dec 20;10:283. doi: 10.1186/1471-2229-10-283. BMC Plant Biol. 2010. PMID: 21171996 Free PMC article.
-
Systematic analysis of alternative first exons in plant genomes.BMC Plant Biol. 2007 Oct 17;7:55. doi: 10.1186/1471-2229-7-55. BMC Plant Biol. 2007. PMID: 17941993 Free PMC article.
-
Genome-wide computational prediction and analysis of core promoter elements across plant monocots and dicots.PLoS One. 2013 Oct 29;8(10):e79011. doi: 10.1371/journal.pone.0079011. eCollection 2013. PLoS One. 2013. PMID: 24205361 Free PMC article.
-
Analyses of phylogeny, evolution, conserved sequences and genome-wide expression of the ICK/KRP family of plant CDK inhibitors.Ann Bot. 2011 May;107(7):1141-57. doi: 10.1093/aob/mcr034. Epub 2011 Mar 7. Ann Bot. 2011. PMID: 21385782 Free PMC article.
Cited by
-
Development and functional analysis of novel genetic promoters using DNA shuffling, hybridization and a combination thereof.PLoS One. 2012;7(3):e31931. doi: 10.1371/journal.pone.0031931. Epub 2012 Mar 14. PLoS One. 2012. PMID: 22431969 Free PMC article.
-
Biological and Molecular Components for Genetically Engineering Biosensors in Plants.Biodes Res. 2022 Nov 9;2022:9863496. doi: 10.34133/2022/9863496. eCollection 2022. Biodes Res. 2022. PMID: 37850147 Free PMC article.
-
DNA structural features of eukaryotic TATA-containing and TATA-less promoters.FEBS Open Bio. 2017 Feb 16;7(3):324-334. doi: 10.1002/2211-5463.12166. eCollection 2017 Mar. FEBS Open Bio. 2017. PMID: 28286728 Free PMC article.
-
Characterization of structural and free energy properties of promoters associated with Primary and Operon TSS in Helicobacter pylori genome and their orthologs.J Biosci. 2012 Jul;37(3):423-31. doi: 10.1007/s12038-012-9214-6. J Biosci. 2012. PMID: 22750980
-
Natural Sequence Variations and Combinations of GNP1 and NAL1 Determine the Grain Number per Panicle in Rice.Rice (N Y). 2020 Feb 28;13(1):14. doi: 10.1186/s12284-020-00374-8. Rice (N Y). 2020. PMID: 32112146 Free PMC article.
References
-
- Alexandrov N, Troukhan M, Brover V, Tatarinova T, Flavell R, Feldmann K. (2006) Features of Arabidopsis genes and genome discovered using full-length cDNAs. Plant Mol Biol 60: 69–85 - PubMed
-
- Allawi HT, Santalucia J. (1997) Thermodynamics and NMR of internal G-T mismatches in DNA. Biochemistry 36: 10581–10594 - PubMed
Publication types
MeSH terms
Substances
LinkOut - more resources
Full Text Sources
