Structural and functional studies indicating altered redox properties of hemoglobin E: implications for production of bioactive nitric oxide
- PMID: 21531715
- PMCID: PMC3123109
- DOI: 10.1074/jbc.M110.183186
Structural and functional studies indicating altered redox properties of hemoglobin E: implications for production of bioactive nitric oxide
Abstract
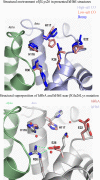
Hemoglobin (Hb) E (β-Glu26Lys) remains an enigma in terms of its contributions to red blood cell (RBC) pathophysiological mechanisms; for example, EE individuals exhibit a mild chronic anemia, and HbE/β-thalassemia individuals show a range of clinical manifestations, including high morbidity and death, often resulting from cardiac dysfunction. The purpose of this study was to determine and evaluate structural and functional consequences of the HbE mutation that might account for the pathophysiology. Functional studies indicate minimal allosteric consequence to both oxygen and carbon monoxide binding properties of the ferrous derivatives of HbE. In contrast, redox-sensitive reactions are clearly impacted as seen in the following: 1) the ∼2.5 times decrease in the rate at which HbE catalyzes nitrite reduction to nitric oxide (NO) relative to HbA, and 2) the accelerated rate of reduction of aquometHbE by L-cysteine (L-Cys). Sol-gel encapsulation studies imply a shift toward a higher redox potential for both the T and R HbE structures that can explain the origin of the reduced nitrite reductase activity of deoxyHbE and the accelerated rate of reduction of aquometHbE by cysteine. Deoxy- and CO HbE crystal structures (derived from crystals grown at or near physiological pH) show loss of hydrogen bonds in the microenvironment of βLys-26 and no significant tertiary conformational perturbations at the allosteric transition sites in the R and T states. Together, these data suggest a model in which the HbE mutation, as a consequence of a relative change in redox properties, decreases the overall rate of Hb-mediated production of bioactive NO.
Figures


Similar articles
-
A transgenic mouse model expressing exclusively human hemoglobin E: indications of a mild oxidative stress.Blood Cells Mol Dis. 2012 Feb 15;48(2):91-101. doi: 10.1016/j.bcmd.2011.12.002. Epub 2012 Jan 18. Blood Cells Mol Dis. 2012. PMID: 22260787 Free PMC article.
-
Crystal structures of HbA2 and HbE and modeling of hemoglobin delta 4: interpretation of the thermal stability and the antisickling effect of HbA2 and identification of the ferrocyanide binding site in Hb.Biochemistry. 2004 Oct 5;43(39):12477-88. doi: 10.1021/bi048903i. Biochemistry. 2004. PMID: 15449937
-
Oxidative instability of hemoglobin E (β26 Glu→Lys) is increased in the presence of free α subunits and reversed by α-hemoglobin stabilizing protein (AHSP): Relevance to HbE/β-thalassemia.Redox Biol. 2016 Aug;8:363-74. doi: 10.1016/j.redox.2016.03.004. Epub 2016 Mar 10. Redox Biol. 2016. PMID: 26995402 Free PMC article.
-
Critical redox and allosteric aspects of nitric oxide interactions with hemoglobin.Antioxid Redox Signal. 2004 Dec;6(6):979-91. doi: 10.1089/ars.2004.6.979. Antioxid Redox Signal. 2004. PMID: 15548895 Review.
-
Protein dynamics explain the allosteric behaviors of hemoglobin.Biochim Biophys Acta. 2008 Sep;1784(9):1146-58. doi: 10.1016/j.bbapap.2008.04.025. Epub 2008 May 8. Biochim Biophys Acta. 2008. PMID: 18519045 Free PMC article. Review.
Cited by
-
HBOC vasoactivity: interplay between nitric oxide scavenging and capacity to generate bioactive nitric oxide species.Antioxid Redox Signal. 2013 Jun 10;18(17):2284-97. doi: 10.1089/ars.2012.5099. Epub 2013 Feb 12. Antioxid Redox Signal. 2013. PMID: 23249305 Free PMC article. Review.
-
The capacity of red blood cells to reduce nitrite determines nitric oxide generation under hypoxic conditions.PLoS One. 2014 Jul 9;9(7):e101626. doi: 10.1371/journal.pone.0101626. eCollection 2014. PLoS One. 2014. PMID: 25007272 Free PMC article.
-
A transgenic mouse model expressing exclusively human hemoglobin E: indications of a mild oxidative stress.Blood Cells Mol Dis. 2012 Feb 15;48(2):91-101. doi: 10.1016/j.bcmd.2011.12.002. Epub 2012 Jan 18. Blood Cells Mol Dis. 2012. PMID: 22260787 Free PMC article.
-
Oxidized Mutant Human Hemoglobins S and E Induce Oxidative Stress and Bioenergetic Dysfunction in Human Pulmonary Endothelial Cells.Front Physiol. 2017 Dec 19;8:1082. doi: 10.3389/fphys.2017.01082. eCollection 2017. Front Physiol. 2017. PMID: 29311995 Free PMC article.
-
Evaluating the capacity to generate and preserve nitric oxide bioactivity in highly purified earthworm erythrocruorin: a giant polymeric hemoglobin with potential blood substitute properties.J Biol Chem. 2015 Jan 2;290(1):99-117. doi: 10.1074/jbc.M114.583260. Epub 2014 Nov 4. J Biol Chem. 2015. PMID: 25371199 Free PMC article.
References
-
- Giardine B., van Baal S., Kaimakis P., Riemer C., Miller W., Samara M., Kollia P., Anagnou N. P., Chui D. H., Wajcman H., Hardison R. C., Patrinos G. P. (2007) Hum. Mutat. 28, 206 - PubMed
-
- Forget B. H., Higgs D. R. (2009) in Disorders of Hemoglobin: Genetics, Pathophysiology, and Clinical Management (Steinberg M. H., Forget B. G., Higgs D. R., Weatherall D. J. eds) 2nd Ed., pp. 25–26, Cambridge University Press, New York
-
- Chotivanich K., Udomsangpetch R., Pattanapanyasat K., Chierakul W., Simpson J., Looareesuwan S., White N. (2002) Blood 100, 1172–1176 - PubMed
-
- Williams T. N. (2006) Curr. Opin. Microbiol. 9, 388–394 - PubMed
-
- Vichinsky E. (2007) American Society Hematology Education Program, pp. 79–83 - PubMed
Publication types
MeSH terms
Substances
Grants and funding
LinkOut - more resources
Full Text Sources
Miscellaneous

