Age-related changes in dopamine signaling in Nurr1 deficient mice as a model of Parkinson's disease
- PMID: 21531044
- PMCID: PMC3155628
- DOI: 10.1016/j.neurobiolaging.2011.03.022
Age-related changes in dopamine signaling in Nurr1 deficient mice as a model of Parkinson's disease
Abstract
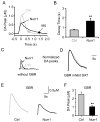
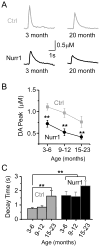
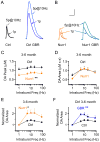
The nuclear receptor related 1 (Nurr1) transcription factor contributes to the development and maintenance of dopamine (DA) neurons in the brain. We found that heterozygous Nurr1 knockout (Nurr1 +/-) influenced the age-dependent decline in the number of DA neurons and influenced DA signaling. We examined the DA marker, tyrosine hydroxylase, using immunohistochemistry, and we measured DA signaling using fast-scan cyclic voltammetry in 3 age groups of wild-type (Nurr1 +/+) and mutant (Nurr1 +/-) mice: 3-6, 9-12, and 15-23 mo old. Prior to significant loss of DA neurons and to the onset of parkinsonian symptoms, young Nurr1 +/- mice (3-6 mo) exhibited a decrease in peak evoked DA release that was partially countered by a decrease in the rate of DA reuptake. As peak evoked DA release declined with age for both the wild-type and Nurr1 +/- mice, both genotypes manifested decreased DA reuptake. As the DA release fell further with age, decreased DA reuptake eventually could not adequately compensate the Nurr1 +/- mice. The results indicated that Nurr1 deficiency led to impaired DA release even before significant DA neuron loss.
Copyright © 2012 Elsevier Inc. All rights reserved.
Conflict of interest statement
There were no conflicts of interest for this study for any of the authors. The animal procedures were appropriate, and the mice were housed and handled in accordance with the guidelines set forth by the animal care committee at Baylor College of Medicine.
Figures


Similar articles
-
Nurr1 deficiency shortens free running period, enhances photoentrainment to phase advance, and disrupts circadian cycling of the dopamine neuron phenotype.Behav Brain Res. 2021 Aug 6;411:113347. doi: 10.1016/j.bbr.2021.113347. Epub 2021 May 13. Behav Brain Res. 2021. PMID: 33991560
-
Age-dependent dopaminergic dysfunction in Nurr1 knockout mice.Exp Neurol. 2005 Jan;191(1):154-62. doi: 10.1016/j.expneurol.2004.08.035. Exp Neurol. 2005. PMID: 15589522
-
Nurr1 is required for maintenance of maturing and adult midbrain dopamine neurons.J Neurosci. 2009 Dec 16;29(50):15923-32. doi: 10.1523/JNEUROSCI.3910-09.2009. J Neurosci. 2009. PMID: 20016108 Free PMC article.
-
The function and mechanisms of Nurr1 action in midbrain dopaminergic neurons, from development and maintenance to survival.Int Rev Neurobiol. 2012;102:1-22. doi: 10.1016/B978-0-12-386986-9.00001-6. Int Rev Neurobiol. 2012. PMID: 22748824 Review.
-
The role of Nurr1 in the development of dopaminergic neurons and Parkinson's disease.Prog Neurobiol. 2005 Sep-Oct;77(1-2):128-38. doi: 10.1016/j.pneurobio.2005.09.001. Epub 2005 Oct 21. Prog Neurobiol. 2005. PMID: 16243425 Review.
Cited by
-
Parkinson's disease: animal models and dopaminergic cell vulnerability.Front Neuroanat. 2014 Dec 15;8:155. doi: 10.3389/fnana.2014.00155. eCollection 2014. Front Neuroanat. 2014. PMID: 25565980 Free PMC article. Review.
-
Molecular characterization and analysis of the porcine NURR1 gene.Biochim Open. 2016 Jul 19;3:26-39. doi: 10.1016/j.biopen.2016.07.001. eCollection 2016 Dec. Biochim Open. 2016. PMID: 29450128 Free PMC article.
-
Association of Nurr1 gene mutations with Parkinson's disease in the Han population living in the Hubei province of China.Neural Regen Res. 2012 Aug 15;7(23):1791-6. doi: 10.3969/j.issn.1673-5374.2012.23.005. Neural Regen Res. 2012. PMID: 25624803 Free PMC article.
-
Role of Protein Damage Inflicted by Dopamine Metabolites in Parkinson's Disease: Evidence, Tools, and Outlook.Chem Res Toxicol. 2022 Oct 17;35(10):1789-1804. doi: 10.1021/acs.chemrestox.2c00193. Epub 2022 Aug 22. Chem Res Toxicol. 2022. PMID: 35994383 Free PMC article. Review.
-
Age-dependent decrease of Nurr1 protein expression in the gerbil hippocampus.Biomed Rep. 2018 Jun;8(6):517-522. doi: 10.3892/br.2018.1094. Epub 2018 May 4. Biomed Rep. 2018. PMID: 29904610 Free PMC article.
References
-
- Abeliovich A, Schmitz Y, Farinas I, Choi-Lundberg D, Ho WH, Castillo PE, Shinsky N, Verdugo JM, Armanini M, Ryan A, Hynes M, Phillips H, Sulzer D, Rosenthal A. Mice lacking alpha-synuclein display functional deficits in the nigrostriatal dopamine system. Neuron. 2000;25(1):239–52. - PubMed
-
- Backman C, Perlmann T, Wallen A, Hoffer BJ, Morales M. A selective group of dopaminergic neurons express Nurr1 in the adult mouse brain. Brain Res. 1999;851(1–2):125–32. - PubMed
-
- Bannon MJ, Whitty CJ. Age-related and regional differences in dopamine transporter mRNA expression in human midbrain. Neurology. 1997;48(4):969–77. - PubMed
-
- Castillo SO, Baffi JS, Palkovits M, Goldstein DS, Kopin IJ, Witta J, Magnuson MA, Nikodem VM. Dopamine biosynthesis is selectively abolished in substantia nigra/ventral tegmental area but not in hypothalamic neurons in mice with targeted disruption of the Nurr1 gene. Mol Cell Neurosci. 1998;11(1–2):36–46. - PubMed
Publication types
MeSH terms
Substances
Grants and funding
LinkOut - more resources
Full Text Sources
Medical
Molecular Biology Databases
Research Materials

