. 2011 Apr 29;145(3):470-82.
doi: 10.1016/j.cell.2011.03.037.

A high-resolution C. elegans essential gene network based on phenotypic profiling of a complex tissue

Affiliations

A high-resolution C. elegans essential gene network based on phenotypic profiling of a complex tissue

Rebecca A Green et al. Cell. .

Abstract

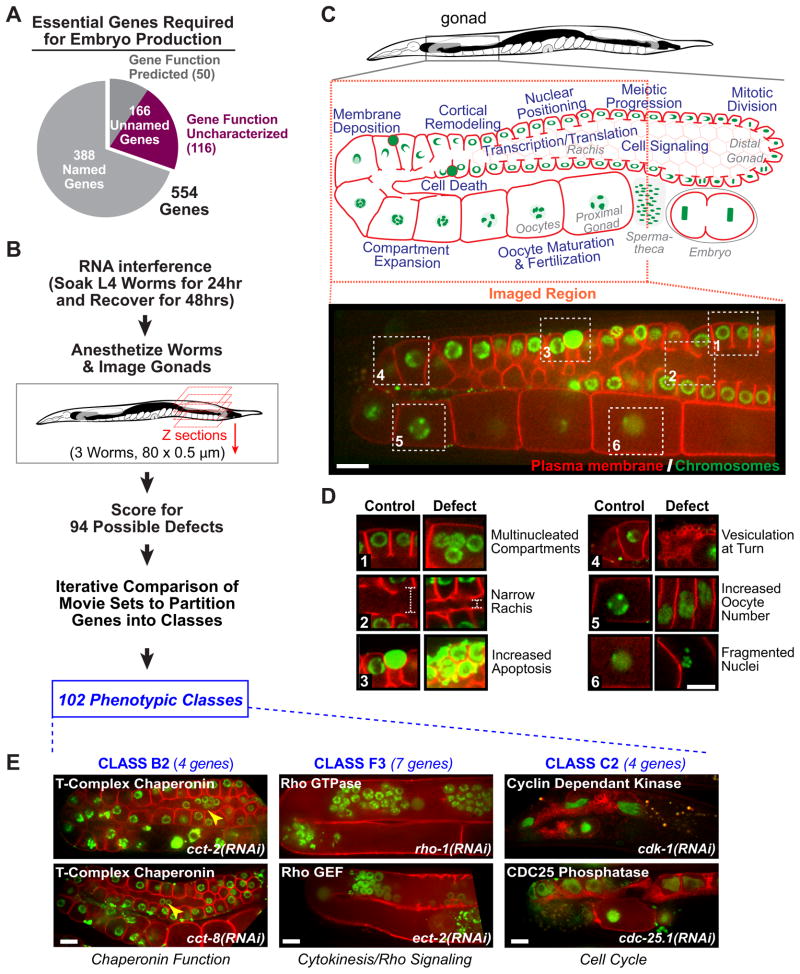
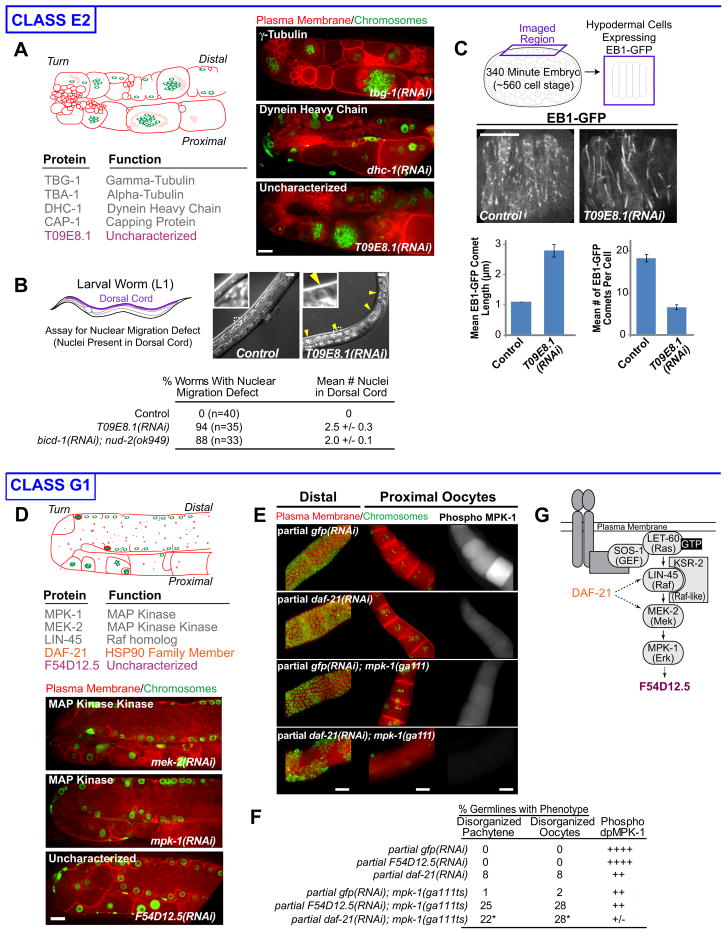
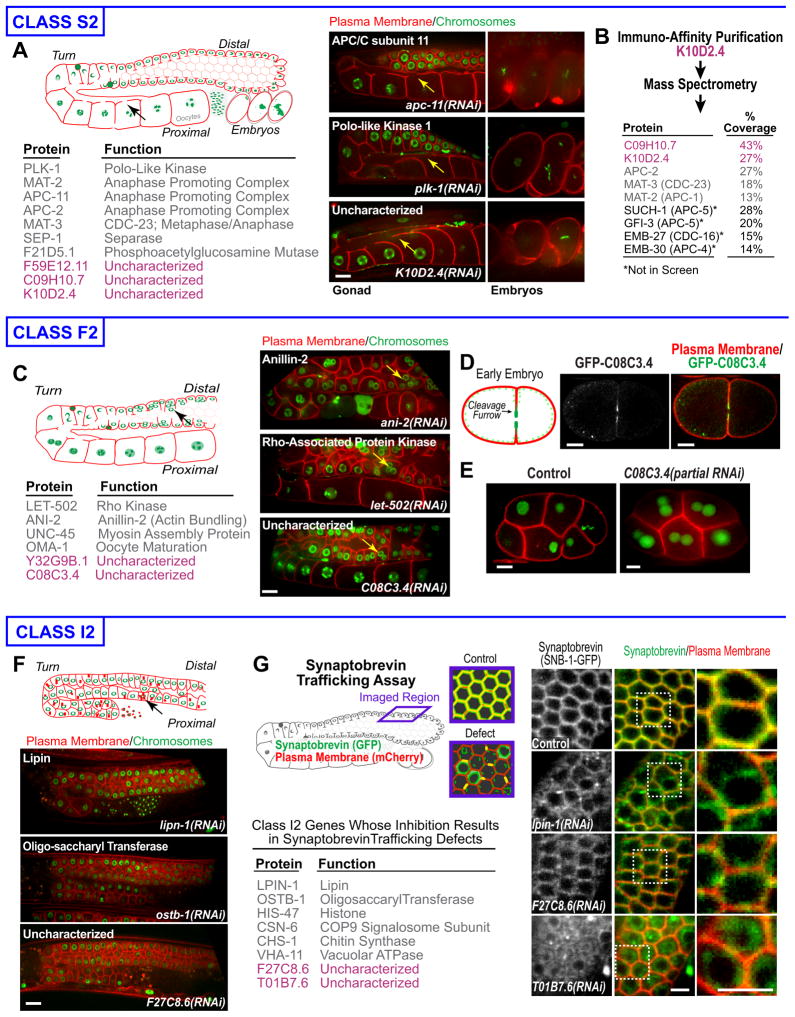
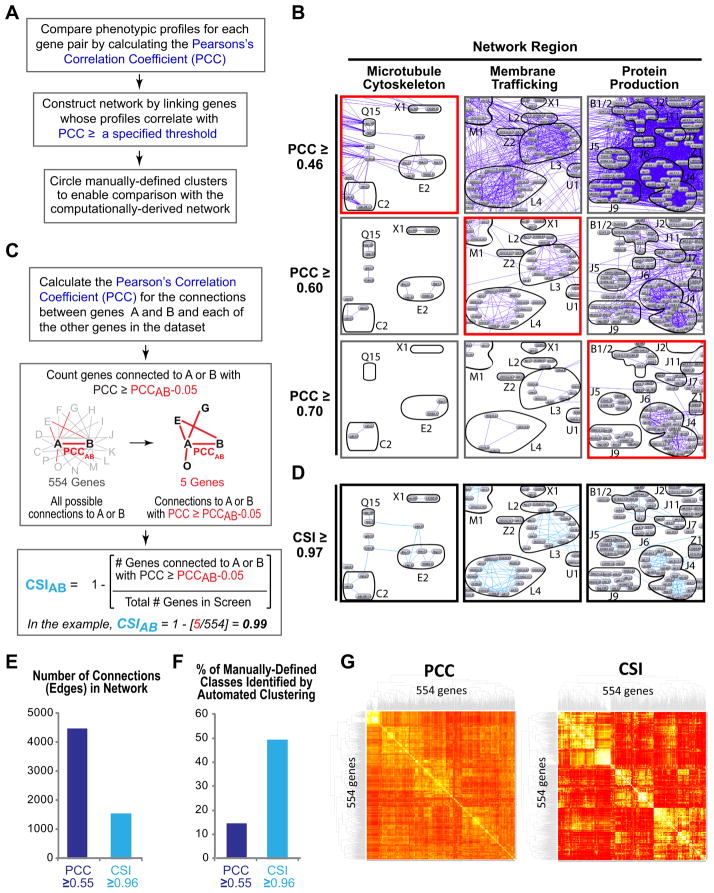
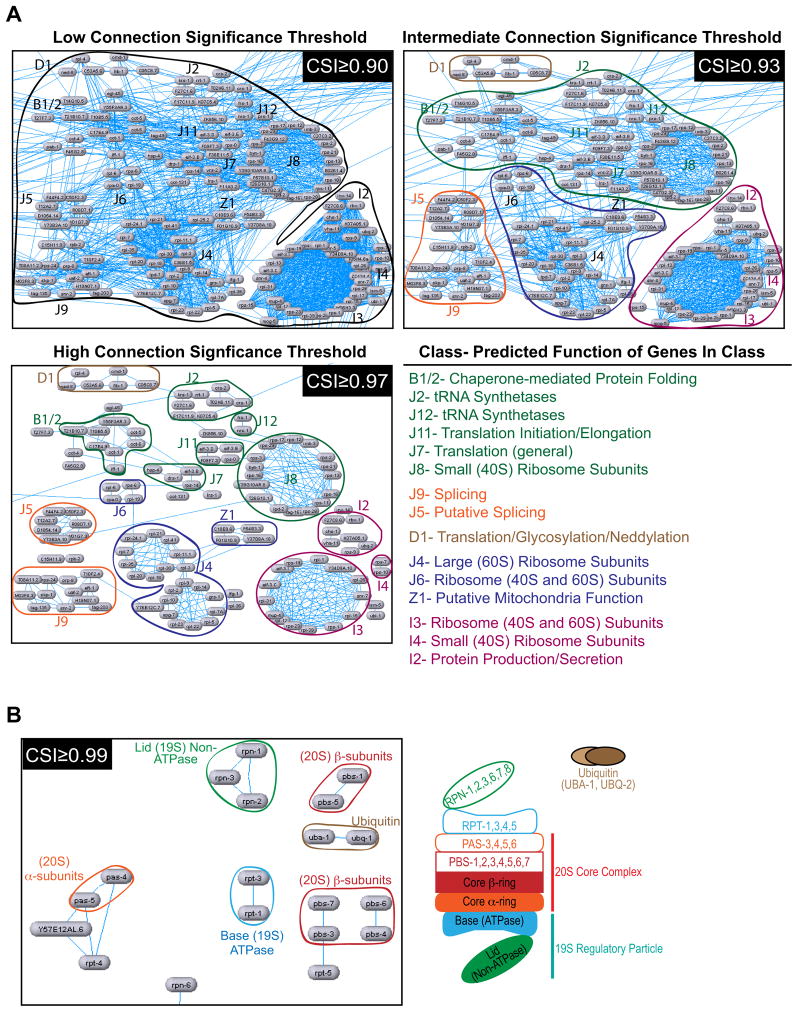
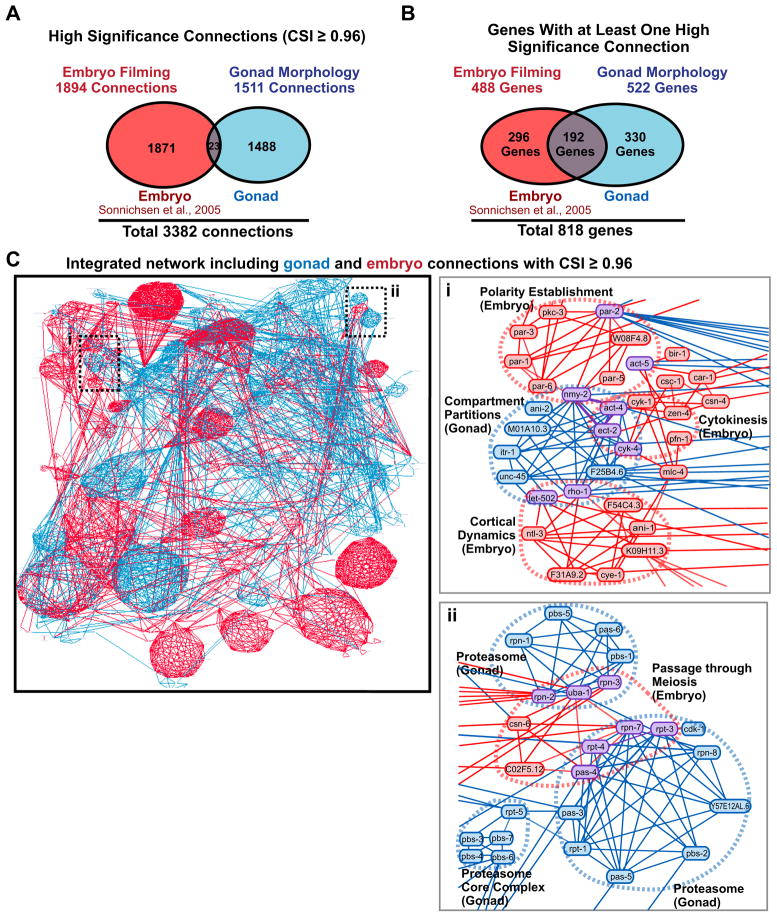
High-content screening for gene profiling has generally been limited to single cells. Here, we explore an alternative approach-profiling gene function by analyzing effects of gene knockdowns on the architecture of a complex tissue in a multicellular organism. We profile 554 essential C. elegans genes by imaging gonad architecture and scoring 94 phenotypic features. To generate a reference for evaluating methods for network construction, genes were manually partitioned into 102 phenotypic classes, predicting functions for uncharacterized genes across diverse cellular processes. Using this classification as a benchmark, we developed a robust computational method for constructing gene networks from high-content profiles based on a network context-dependent measure that ranks the significance of links between genes. Our analysis reveals that multi-parametric profiling in a complex tissue yields functional maps with a resolution similar to genetic interaction-based profiling in unicellular eukaryotes-pinpointing subunits of macromolecular complexes and components functioning in common cellular processes.


Figures

Figure 1
Figure 1. Phenotypic profiling using a high-content assay based on the architecture of a complex tissue
A. Breakdown of the 554 genes in the sterile collection. B. Screen flow chart. C. The C. elegans gonad is a complex dynamic tissue whose architecture depends on a broad spectrum of interacting cellular processes (blue text on the schematic). Spinning disc confocal microscopy was used to collect an 80 plane two-color z-series of each gonad. The imaged region is indicated (red dashed box) and a sample central z-section from a control gonad is shown. D. Six sample defects are illustrated by pairing the numbered boxed regions from the control gonad in C with the corresponding regions from gonads with the indicated defects. E. Central plane images from two gene knockdowns in 3 phenotypic classes. Knockdowns in Class B2 (left column), which contains chaperonin complex subunits, led to rounded compartments and nuclei that fell out of their compartments (yellow arrowheads). Knockdowns in Class F3 (middle column), which contains genes implicated in Rho GTPase signaling, led to “tubulated” gonads with clustered nuclei. Knockdowns in Class C2 (right column), which contains cell cycle regulators, led to gonads with few compartments/oocytes. Bars, 10 μm. See also Figure S1, Table S1 and Table S2.
Figure 2
Figure 2. Validation of manual classification I
Class E2: A. List of the genes in Class E2. Schematic and central plane images illustrate the class phenotype. B. Nuclei are in the dorsal cords of T09E8.1(RNAi) (yellow arrowheads), but not control, L1 worms (insets 2.4X), reflecting a hypodermal cell nuclear migration defect. Table shows quantification of the nuclear migration defect. The effects of simultaneous inhibition of the dynein-regulatory proteins BICD-1 and NUD-2 quantified from the dataset in Fridolfsson et al. (2010) are shown for comparison. C. The effect of T09E8.1 knockdown on microtubule arrays in the hypodermis (schematic) was monitored by timelapse imaging of an EB1-GFP fusion (Fridolfsson and Starr, 2010). Bar graphs show the mean length (left) and number (right) of EB1-GFP comets. Error bars are the SE. Class G1: D. Class G1 contains 3 characterized genes implicated in MAPK signaling (gray), 1 characterized gene not previously implicated in MAPK signaling (orange), and 1 uncharacterized gene (purple). Schematic and central plane images illustrate the class phenotype. E. Partial RNAi of daf-21, or GFP as a control, was performed in the presence or absence of a weak mpk-1 loss-of-function mutation (ga111). Gonads were fixed and stained for chromosomes (DAPI, green), the plasma membrane (SYN-4 and PTC-1, red), and activated MPK-1 (Phospho-MPK-1, right panels). All analysis was performed in the rrf-1(pk1417) background in which RNAi is effective in the gonad, but not in the surrounding somatic cells. F. Quantification of phenotypes resulting from partial RNAi of daf-21 or F54D12.5 in the mpk-1(ga111) background (see Table S3). * Percentages do not include the 21% of germlines that showed a severe MPK-1 “null” phenotype. G. Schematic places DAF-21 and F54D12.5 in the MAPK signaling pathway. Error bars are the SE. Bars, 10 μm. See also Figure S2, Table S2 and Table S3
Figure 3
Figure 3. Validation of manual classification II
Class S2: A. List of the genes in Class S2. Schematic and central plane images of gonads (left) and adjacent embryos (right) illustrate the class phenotype. B. List of relevant proteins identified by mass spectrometry in an immuno-affinity purification of K10D2.4 from worm extracts, along with percent coverage. Proteins encoded by the uncharacterized Class S2 genes (purple) are listed, along with APC components in Class S2 (gray) and additional APC components not in the screen (black). Class F2: C. List of the genes in Class F2. Schematic and central plane images illustrate the class phenotype. D. Embryo co-expressing GFP-C08C3.4 (green) and an mCherry tagged plasma membrane probe (red) during the first cell division. E. Central plane images of control and C08C3.4(RNAi) embryos expressing mCherry-histone H2B (green) and a GFP plasma membrane probe (red). Multiple nuclei in each cell in the C08C3.4(RNAi) embryo are due to cytokinesis failure. Class I2: F. Schematic and central plane images illustrate the Class I2 phenotype, which includes punctate debris containing the plasma membrane probe (arrow in schematic). G. Schematic of the trafficking assay. List of Class I2 genes with defects in the SNB-1-GFP trafficking assay. Images of the assay for 1 characterized and 2 uncharacterized Class I2 genes. Bars are 10μm in A-F and 5 μm in G. See also Table S2.
Figure 4
Figure 4. Constructing gene networks using Connection Specificity Index (CSI) instead of the PCC reduces connection noise and allows connections of similar functional significance to be viewed across the entire network at a uniform threshold
A. Flowchart of the steps used to construct the gene networks in B. B. Gene networks were constructed by displaying connections (dark blue lines) between genes whose knockdown profiles were correlated with a PCC ≥ three specified thresholds (0.46, top; 0.60, middle; 0.70, bottom). Each column shows a network region, labeled based on the primary function of the genes in that region. To compare the computational network to the manually-defined phenotypic classes, gene groups from manually-assigned classes were circled and labeled. The optimal PCC threshold at which significant connections were displayed and non-specific connections were filtered out (red boxes) was different for different network regions. C. Method used to calculate the CSI. D. Gene network showing the same regions in B constructed by displaying connections (light blue lines) with a CSI ≥ 0.97. E. Bar graph showing the number of connections in gene networks constructed using PCC or CSI thresholds of 0.55 or 0.96, respectively. These thresholds were chosen because they are the highest thresholds that retain most of the genes in the network; genes drop out of the network when they no longer make any connections with a PCC/CSI that exceeds the specified threshold. F. Bar graph showing the percent of the 49 manually-defined phenotypic classes containing 4 or more genes identified by an automated clustering algorithm (MINE) in networks constructed using PCC or CSI thresholds of 0.55 or 0.96, respectively. G. Heatmap dendograms of the sterile gene set constructed based on the PCC or the CSI. See also Figure S3 and Table S4.
Figure 5
Figure 5. Varying the CSI threshold reveals functional modularity in the gene network at different levels of resolution
A. The region of the gene network involved in protein production is shown using three different CSI thresholds to filter displayed connections. The gene clusters apparent at each threshold are circled and gene groups from manually-defined classes are labeled. B. The region of the network involved in protein degradation is shown using the very high CSI threshold of 0.99. The connections that remain link components within specific proteasome subcomplexes (illustrated schematically on the right). See also Figure S4 and Table S5.
Figure 6
Figure 6. The CSI enables integration of high-content data sets to generate a global view of the essential C. elegans gene network
A. Venn diagram showing the high significance connections identified by the embryo-filming (Sönnichsen et al., 2005) and gonad architecture data. B. Venn diagram showing the genes that make at least one high significance connection identified by each dataset. C. Bird’s eye view of the integrated network combining high-significance connections based on the gonad (blue) and embryo (red) data. Insets (i–ii) highlight regions where the gonad and embryo data intersect (connections identified by both datasets are purple). See also Figure S5.

Comment in

  • Guilt by phenotypic association.
    de Souza N. de Souza N. Nat Methods. 2011 Jul;8(7):532-3. doi: 10.1038/nmeth0711-532a. Nat Methods. 2011. PMID: 21850732 No abstract available.

Similar articles

Cited by

References

    1. Arur S, Ohmachi M, Nayak S, Hayes M, Miranda A, Hay A, Golden A, Schedl T. Multiple ERK substrates execute single biological processes in Caenorhabditis elegans germ-line development. Proc Natl Acad Sci U S A. 2009;106:4776–4781. - PMC - PubMed
    1. Bader GD, Hogue CW. An automated method for finding molecular complexes in large protein interaction networks. BMC Bioinformatics. 2003;4:2. - PMC - PubMed
    1. Bakal C, Aach J, Church G, Perrimon N. Quantitative morphological signatures define local signaling networks regulating cell morphology. Science. 2007;316:1753–1756. - PubMed
    1. Bochtler M, Ditzel L, Groll M, Hartmann C, Huber R. The proteasome. Annu Rev Biophys Biomol Struct. 1999;28:295–317. - PubMed
    1. Boone C, Bussey H, Andrews BJ. Exploring genetic interactions and networks with yeast. Nat Rev Genet. 2007;8:437–449. - PubMed

Publication types

LinkOut - more resources