. 2011 Jul;85(13):6687-701.
doi: 10.1128/JVI.00246-11. Epub 2011 Apr 27.

Crystal structures of GII.10 and GII.12 norovirus protruding domains in complex with histo-blood group antigens reveal details for a potential site of vulnerability

Affiliations

Crystal structures of GII.10 and GII.12 norovirus protruding domains in complex with histo-blood group antigens reveal details for a potential site of vulnerability

Grant S Hansman et al. J Virol. 2011 Jul.

Abstract

Noroviruses are the dominant cause of outbreaks of gastroenteritis worldwide, and interactions with human histo-blood group antigens (HBGAs) are thought to play a critical role in their entry mechanism. Structures of noroviruses from genogroups GI and GII in complex with HBGAs, however, reveal different modes of interaction. To gain insight into norovirus recognition of HBGAs, we determined crystal structures of norovirus protruding domains from two rarely detected GII genotypes, GII.10 and GII.12, alone and in complex with a panel of HBGAs, and analyzed structure-function implications related to conservation of the HBGA binding pocket. The GII.10- and GII.12-apo structures as well as the previously solved GII.4-apo structure resembled each other more closely than the GI.1-derived structure, and all three GII structures showed similar modes of HBGA recognition. The primary GII norovirus-HBGA interaction involved six hydrogen bonds between a terminal αfucose1-2 of the HBGAs and a dimeric capsid interface, which was composed of elements from two protruding subdomains. Norovirus interactions with other saccharide units of the HBGAs were variable and involved fewer hydrogen bonds. Sequence analysis revealed a site of GII norovirus sequence conservation to reside under the critical αfucose1-2 and to be one of the few patches of conserved residues on the outer virion-capsid surface. The site was smaller than that involved in full HBGA recognition, a consequence of variable recognition of peripheral saccharides. Despite this evasion tactic, the HBGA site of viral vulnerability may provide a viable target for small molecule- and antibody-mediated neutralization of GII norovirus.


Figures
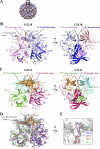
Fig. 1.
Fig. 1.
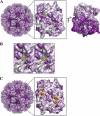
Structures of the norovirus GII.10 and GII.12 P domains. The GII.10 and GII.12 P1 subdomains are very similar, with greater differences observed in the P2 subdomains. (A) The GII.10 VLP was modeled from the shell domain of the norovirus (NV) VLP (PDB ID, 1IHM) and the unbound GII.10 P domain (PDB ID, 3ONU). The GII.10 VLP (T = 3) was modeled with different monomer interactions, A/B and C/C, where each A, B, and C monomer was colored light blue, salmon, and orange, respectively. The boxed region showed the location of the P domain capsid dimer. (B) The X-ray crystal structure of the unbound GII.10 P domain dimer was determined to have 1.4-Å resolution and colored according to monomers (chains A and B) and P1 and P2 subdomains, i.e., chain A P1 (blue), chain A P2 (light blue), chain B P1 (violet), and chain B P2 (salmon). The chain A P2-extended loop protruded out from the side of the P domain (the chain B extended loop was not fitted into the structure). The P1-interface loop was at the dimer interface and surface exposed. (C) The X-ray crystal structure of the unbound GII.12 P domain monomer determined to 1.6-Å resolution (shown here as a modeled dimer) was colored according to monomers and P1 and P2 subdomains, i.e., chain A P1 (hot pink), chain A P2 (orange), chain B P1 (green), and chain B P2 (cyan). As for the GII.10 P1-interface loop, the GII.12 P1-interface loop was at the dimer interface and surface exposed. (D) Superposition of GII.10 (PDB ID, 3ONU), GII.12 (PDB ID, 3R6J), GII.4 (PDB ID, 2OBR), and GI.1 (PDB ID, 2ZL5), colored as shown in panels B and C, dark gray, and light gray, respectively, indicated that the four structures were very similar, except for several differences, including the P1-interface loop and the P2-extended loop. (E) The P1-interface loop (a close-up 90° rotation of panel D) was located at a dimer interface for all four structures. The lengths of the P1-interface loops were the same for GII.10, GII.12, and GII.4 but shorter for GI.1 (residues 445 to 456, 432 to 443, 436 to 447, and 425 to 431, respectively).
Fig. 2.
Fig. 2.
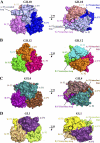
Surface comparisons of the GII.10 (PDB ID, 3ONU), GII.12, GII.4 (PDB ID, 2OBR), and GII.1 (PDB ID, 2ZL5) P domain dimer structures. The GII HBGA binding sites (black circles in panels A to C) involve a dimeric capsid interface that is formed primarily by the P2 subdomain and includes a P1-interface loop, whereas the GI HBGA binding site (black circle in panel D) is monomeric, involves only a single P2 subdomain, and makes no contact with the P1 subdomain. (A) The GII.10 P2 subdomain had an amino acid insertion (relative to those of the other GII sequences), which corresponded to a P2-extended loop. (B) The GII.12 P2 subdomain was somewhat unlike the other two GII surfaces, having a more pointed P2 subdomain. (C) The GII.4 P2 subdomain was more similar to that of GII.10 but had a less pointed P2 subdomain top surface. (D) The GI.1 P domain appears somewhat flatter than that of the GII structures.
Fig. 3.
Fig. 3.
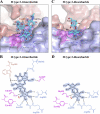
GII.10 P domain and H type 2 (trisaccharide and disaccharide) interactions. The H type 2-tri- and -disaccharide binding site is at the same location on the P domain and utilizes identical residues to bind the terminal αfucose1-2 saccharide. (A) Close-up surface and ribbon representation of the GII.10 P domain (colored as described in the legend to Fig. 1B) showing the bound H type 2-trisaccharide (cyan) and electron density map contoured at 1.0 sigma. (B) GII.10 P domain and H type 2-trisaccharide hydrophilic and hydrophobic interactions (colored as described in the legend to Fig. 1B). The HBGA outline was shaded in blue, the black dotted lines represent the hydrogen bonds, the red dotted line represents the hydrophobic interaction from Tyr452, and the sphere represents water molecules. For simplicity, only the backbone was shown for residues that were backbone mediated. Hydrogen bond distances were less than 3.2 Å, though the majority was ∼2.8 Å. (C) Close-up surface and ribbon representation of GII.10 showing the bound H type 2 disaccharide (cyan) and the electron density map at 1.0 sigma. (D) GII.10 P domain and H type 2-disaccharide hydrophilic and hydrophobic interactions.
Fig. 4.
Fig. 4.
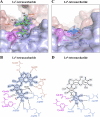
GII.10 P domain and Ley and Leb (tetrasaccharide) interactions. The complete Ley-tetrasaccharide easily fits into electron density and shows extensive hydrogen bonding interactions, whereas only αfucose1-2 of Leb can be fit into the observed electron density; these differences in bound HBGA structure are likely the consequences of different glycosidic bonds on the third saccharide ring (see the text). (A) Close-up surface and ribbon representation of the GII.10 P domain showing the bound Ley-tetrasaccharide (green) and the electron density map contoured at 1.0 sigma. (B) GII.10 P domain and Ley hydrophilic and hydrophobic interactions (colored as described in the legend to Fig. 1B). (C) Close-up surface and ribbon representation of the GII.10 P domain showing the bound Leb-tetrasaccharide (blue) and the electron density map at 1.0 sigma. (D) GII.10 P domain and Leb-tetrasaccharide hydrophilic and hydrophobic interactions. The HBGA subunits that could not be fitted were outlined in light blue.
Fig. 5.
Fig. 5.
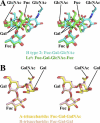
Stereo views of H type 2/Ley and type A/B superposition. For H type 2 and Ley HBGAs, only fucose is positioned similarly, whereas for type A and B HBGAs, all saccharides are held in practically identical positions. (A) Stereo view of the H type 2 (cyan) and Ley (green), showing the similar orientation of αfucose1-2 but the different positions of the other saccharides. (B) Stereo view of types A and B (yellow and pink, respectively), showing the similar orientations of each saccharide.
Fig. 6.
Fig. 6.
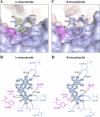
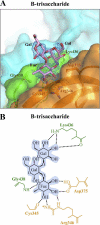
GII.10 P domain and type A and B (trisaccharide) interactions. The GII.10 P domain interacts with type A and B HBGAs in virtually identical ways. (A) Close-up surface and ribbon representation of the GII.10 P domain showing the bound A-trisaccharide (yellow) and the electron density map contoured at 1.0 sigma. (B) GII.10 P domain and A-trisaccharide hydrophilic and hydrophobic interactions. (C) Close-up surface and ribbon representation of the GII.10 P domain showing the bound B-trisaccharide (pink) and the electron density map at 1.0 sigma. (D) GII.10 P domain and B-trisaccharide hydrophilic and hydrophobic interactions.
Fig. 7.
Fig. 7.
GII.12 P domain and B-trisaccharide interaction. The GII.12 P domain binds αfucose1-2 of type B HBGA with hydrogen bonds similar to those of GII.10, except that the carbonyl of Cys345 replaces that of Asn355. (A) Close-up surface and ribbon representation of the GII.12 P domain (colored as described in the legend to Fig. 1C and shown as a dimer) showing the bound B-trisaccharide (pink) and the electron density map contoured at 1.0 sigma. (B) GII.12 P domain and B-trisaccharide hydrophilic interactions. The asterisk on Arg346 indicates that a hydrogen bond interaction was slightly longer (3.3 Å) than the other bonds, usually less than 3.1 Å.
Fig. 8.
Fig. 8.
Surface representations of GII amino acid conservation and putative site of vulnerability for GII noroviruses. Antigenic diversity of noroviruses is seen primarily on the outermost surface of the capsid, although patches of conservation on the top surface are observed. The most prominent of these patches correspond to the P domain-binding sites of the HBGAs described here. (A) An alignment of GII genotypes was used to map the amino acid conservation and variability on the GII.10 P domain dimer structure. The color-coded conservation ranged from a deep purple, represented by highly conserved amino acids, to white, represented by highly variable amino acids. GII conservation was mapped onto a model of the viral capsid (left), with a zoomed-in P domain dimer outer-facing surface (middle) and a 90° dimer rotation that shows the difference in conservation of the outer- and inner-facing surfaces (right). The outer-facing surface (top portion) is substantially less conserved, with two major surface patches of conserved residues overlapping the HBGA binding site. (The highly conserved but nonprotruding portions of the capsid correspond to the shell domain.) (B) Close-up stereo view of panel A, middle, showing the six different HBGAs bound to the GII.10 P domain. (C) Surface representation of GII.10 amino acid conservation was obtained as described above and mapped onto the GII.10 P domain structure. The identified site of vulnerability (yellow) was defined as the surface area of the following GII.10 residues participating in conserved hydrogen-bonding interactions with αfucose1-2: Asn355, Arg356, Asp385 from one subunit, and Gly451 from the other subunit.

Similar articles

Cited by

References

    1. Adams P. D., et al. 2010. PHENIX: a comprehensive Python-based system for macromolecular structure solution. Acta Crystallogr. D Biol. Crystallogr. 66:213–221 - PMC - PubMed
    1. Ahmad S., Gromiha M., Fawareh H., Sarai A. 2004. ASAView: database and tool for solvent accessibility representation in proteins. BMC Bioinformatics 5:51. - PMC - PubMed
    1. Bu W., et al. 2008. Structural basis for the receptor binding specificity of Norwalk virus. J. Virol. 82:5340–5347 - PMC - PubMed
    1. Cao S., et al. 2007. Structural basis for the recognition of blood group trisaccharides by norovirus. J. Virol. 81:5949–5957 - PMC - PubMed
    1. Carrillo-Tripp M., et al. 2009. VIPERdb2: an enhanced and web API enabled relational database for structural virology. Nucleic Acids Res. 37:D436–D442 - PMC - PubMed

Publication types

MeSH terms