. 2011 Mar 30;5(1):13411.
doi: 10.1063/1.3553235.

Biomimetic micro∕nanostructured functional surfaces for microfluidic and tissue engineering applications

Biomimetic micro∕nanostructured functional surfaces for microfluidic and tissue engineering applications

E Stratakis et al. Biomicrofluidics. .

Abstract

This paper reviews our work on the application of ultrafast pulsed laser micro∕nanoprocessing for the three-dimensional (3D) biomimetic modification of materials surfaces. It is shown that the artificial surfaces obtained by femtosecond-laser processing of Si in reactive gas atmosphere exhibit roughness at both micro- and nanoscales that mimics the hierarchical morphology of natural surfaces. Along with the spatial control of the topology, defining surface chemistry provides materials exhibiting notable wetting characteristics which are potentially useful for open microfluidic applications. Depending on the functional coating deposited on the laser patterned 3D structures, we can achieve artificial surfaces that are (a) of extremely low surface energy, thus water-repellent and self-cleaned, and (b) responsive, i.e., showing the ability to change their surface energy in response to different external stimuli such as light, electric field, and pH. Moreover, the behavior of different kinds of cells cultured on laser engineered substrates of various wettabilities was investigated. Experiments showed that it is possible to preferentially tune cell adhesion and growth through choosing proper combinations of surface topography and chemistry. It is concluded that the laser textured 3D micro∕nano-Si surfaces with controllability of roughness ratio and surface chemistry can advantageously serve as a novel means to elucidate the 3D cell-scaffold interactions for tissue engineering applications.


Figures

Figure 1
Figure 1
Side-view scanning electron microscope image (45°) of Si surfaces structured by 800 nm, 180 fs irradiation at different laser fluences. (a) 0.37 J∕cm2, (b) 0.78 J∕cm2, (c) 1.56 J∕cm2, and (d) 2.47 J∕cm2 (scale bar of 5 μm). Higher magnifications of the obtained structures are shown in the corresponding insets (scale bar of 1 μm).
Figure 2
Figure 2
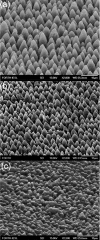
Side scanning electron microscope view (45°) of an ultrafast laser-structured initial Si surface (a), the same surface replicated on a photopolymer (ORMOCER) (b) and on a biodegradable polymer (PLGA) (c).
Figure 3
Figure 3
Side scanning electron microscope view (45°) of silicon surfaces structured by femtosecond irradiation at different laser fluencies. The corresponding photographs of water droplets placed on the surfaces coated with hydrophobic silane monolayers are also shown.
Figure 4
Figure 4
Static contact angle (●) and sliding angle (○) measurements of a water drop on structured Si surfaces plotted as a function of laser fluence. For fluences below 0.5 J∕cm2, the sliding angles are higher than the 30° limit of our measurement setup. The lines are guides to the eye. Reproduced with permission from V. Zorba et al., Appl. Phys. A: Mater. Sci. Process. 93, 819 (2008). Copyright 2008. Springer.
Figure 5
Figure 5
(a) Top left: picture of a water droplet on an artificial structured silicon surface (dark area). Top right: static contact angle measurement of a water droplet of 0.78 mm radius on that surface; the contact angle is 154°±1°. Bottom left: SEM image of the artificial surface comprising protrusions with conical or pyramidal asperities (scale bar 5 μm). Bottom right: high magnification SEM image of a single protrusion depicting nanostructures of sizes up to few hundred nanometers on the slopes of the protrusions (scale bar 1 μm). The surface was structured in the presence of 500 Torr SF6 at a laser fluence of 2.47 J∕cm2 with an average of 500 pulses. (b) Top left: picture of water droplets on a Nelumbo nucifera (lotus) leaf. Top right: static contact angle measurement of a water droplet of 0.78 mm radius on the lotus leaf surface; the contact angle is 153°±1°. Bottom left: SEM image of the leaf surface (scale bar 5 μm). Bottom right: high magnification SEM image of a single papillose depicting branch like protrusions with a size of about 150 nm (scale bar 1 μm). Reproduced with permission from V. Zorba et al., Adv. Mater. (Weinheim, Ger.) 20, 4049 (2008). Copyright 2008. Wiley-VCH Verlag GmbH & Co. KGaA.
Figure 6
Figure 6
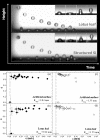
(Top) Selected snapshots of a water drop impinging on the surface of the lotus leaf and the artificial laser-structured silanized silicon surface. The minima and maxima of the drop trajectory are shown here as a function of time. The drop in both cases bounces back numerous times before it comes to rest on the surfaces after ∼400 ms. The drop is significantly deformed during each impact; the dynamics of this process is shown at the insets. (Bottom) Restitution coefficient ε=υ∕υ, where υ is the center of mass velocity right after the impact and υ that right before the impact, as a function of the impact velocity υ for an artificial silane-coated structured silicon surface [(a) and (c)] and a lotus leaf surface [(b) and (d)] for two different sizes of falling water droplets with radii R of 0.84 mm [(a) and (b)] and 1.35 mm [(c) and (d)]. The dashed lines signify the threshold velocities of 0.11 and 0.17 m∕s for the artificial surfaces for the two sizes of water droplets, respectively.
Figure 7
Figure 7
(a) Side SEM view of Si surfaces structured by femtosecond irradiation at laser fluence of 0.17 J∕cm2. The inset shows a higher magnification of the top of a single microcone. (b) Top SEM view of a nanograined ZnO film prepared by PLD on a flat Si substrate. A cross-sectional image of the film is shown in the inset. (c) Side SEM view of a ZnO coated Si surface structured by femtosecond irradiation at laser fluence of 0.17 J∕cm2. Higher magnification of the top of a single microcone (the scale bar is 100 nm), shown in the inset, reveals the double scale roughness of the structures. (d) The same as in (a) but at laser fluence of 2.1 J∕cm2. Reproduced with permission from E. L. Papadopoulou et al., J. Phys. Chem. C 113, 2891 (2009). Copyright 2009. American Chemical Society.
Figure 8
Figure 8
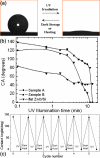
(a) Photographs of the shape of a water droplet on sample B before (left) and after (right) UV illumination. The transition from hydrophobicity to superhydrophilicity is reversible upon dark storage or thermal heating. (b) Dependence of the water contact angle on the UV illumination for sample A (ZnO nanostructured thin film on the Si microstructure prepared at 0.21 J∕cm2), sample B (ZnO nanostructured thin film on the Si microstructure prepared at 1.1 J∕cm2), and a ZnO nanostructured thin film. (c) Reversible switch from hydrophobicity to superhydrophilicity for sample B under the alternation of UV irradiation and thermal heating at 200 °C for 1 h. Sample A exhibits a similar response.
Figure 9
Figure 9
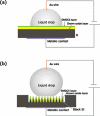
The electrowetting-on-dielectric system for (a) flat and (b) structured Si substrates.
Figure 10
Figure 10
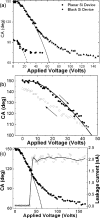
(a) Contact angle of an 85% glycerol drop as a function of applied voltage for (a) a flat (solid circles) and a black Si surface (solid triangles) of a laser fluence of 1.69 J∕cm2. The lines represent the fits to Eqs. 1, 3 with parameters shown in the text. (b) Reversibility of the EWOD effect; the arrows indicate the decrease∕increase of the applied bias, respectively. (c) CA (on the left y-axis) and leakage current (on the right y-axis) dependence on the applied voltage. The solid line is a fit to Eq. 3 with parameters shown in the text; the dashed line is a guide to the eye.
Figure 11
Figure 11
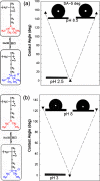
(a) Characteristic images of water droplets residing on the PDPAEMA functionalized hierarchically structured surface following immersion at pH 8.5, pH 2.5 (complete wetting), and again at pH 8.5. The scheme shows the protonation/deprotonation process of PDPAEMA. (b) Characteristic images of water droplets residing on the PDEAEMA functionalized artificially structured surface following immersion at pH 8, pH 3 (complete wetting), and again at pH 8. The scheme shows the protonation/deprotonation process of PDEAEMA. Reproduced with permission from E. Stratakis et al., Chem. Commun. (Cambridge) 46, 4136 (2010). Copyright 2010. The Royal Society of Chemistry.
Figure 12
Figure 12
(a) Average contact angle values of water drops residing on the PDPAEMA functionalized hierarchically structured surface following successive immersions at pH 8.5 and pH 2.5. Reproduced with permission from E. Stratakis et al., Chem. Commun. (Cambridge) 46, 4136 (2010). Copyright 2010. The Royal Society of Chemistry.
Figure 13
Figure 13
Restitution coefficient as a function of the impact velocity for the PDPAEMA functionalized surface, after immersion at pH 8.5 (filled squares), and a natural lotus leaf surface (open circles). The line signifies the threshold velocity. Inset: selected snapshots of a water drop impinging on the surface. The maxima of the drop trajectory are shown as a function of time.
Figure 14
Figure 14
(a) Picture of a polished Si wafer (i) and side SEM views of the as-prepared Si spikes surfaces structured at four different laser fluencies: (ii) 0.34 J∕cm2 (A1), (iii) 0.56 J∕cm2 (A2), (iv) 0.90 J∕cm2 (A3), (v) 1.69 J∕cm2 (A4). (b) Photographs of water droplets on the patterned Si surfaces. (c) SEM micrographs of fibroblast cells adhering to the surfaces. (d) Confocal laser microscopy pictures of fibroblast cells cultured for 3 days on the respective surfaces. Reproduced with permission from A. Ranella et al., Acta Biomater. 6, 2711 (2010). Copyright 2010. Elsevier.
Figure 15
Figure 15
(a) Neuronal cluster on the Si spikes area. (b) Detail corresponding to white lined inset of (a), showing a long neurite that has attached and grown over the spikes. (c) Detail corresponding to white lined inset of (b), showing protrusions of neurolemma growing over and engulfing the top of the spikes. (d) Detail corresponding to black lined inset of (a), showing the 3D web of cytoplasmic processes growing along the direction vertical to the culture plane. The arrows indicate how multiple processes may initiate from one neurite. Reproduced with permission from E. L. Papadopoulou et al., Tissue Eng Part C Methods 16, 497 (2010). Copyright 2010. Mary Ann Liebert.
Figure 16
Figure 16
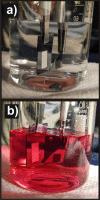
Pictures of the as-prepared superhydrophobic (sample A1, on the left) and oxidized superhydrophilic (sample B4, on the right) patterned regions immersed in water (a) and cell culture medium (b), respectively. The silvery shine is visible only on the superhydrophobic patterned region of the A1 sample while it is absent on flat regions and the less hydrophobic patterned area of the B4 sample. Reproduced with permission from A. Ranella et al., Acta Biomater. 6, 2711 (2010). Copyright 2010. Elsevier.
Figure 17
Figure 17
Cell density of fibroblasts on flat and oxidized Si, the as-prepared (series A) and oxidized (series B) patterned Si surfaces after 72 h incubation. All experiments were done on triplicates and the cell density values shown are the calculated mean values. Reproduced with permission from A. Ranella et al., Acta Biomater. 6, 2711 (2010). Copyright 2010. Elsevier.
Figure 18
Figure 18
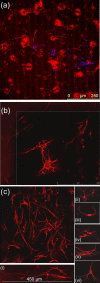
(a) Primary neuronal culture immunostained both for beta III tubulin (red) and GFAP (blue) at 5 days in vitro. The micrograph demonstrates the low numbers of GFAP immunopositive cells and staining colocalization. (b) Neuron-specific immunohistochemistry and confocal microscopy using antibeta III tubulin primary antibody. Corner of spike area showing some cells in a cluster (scale bar of 250 mm). (c) Illustration of the phenomenal neuritic sprouting and extension on the substrate surface. (i) Some of the neurons showed extraordinary extension. Examples of different neuronal types and the formation of varicosities [(ii)–(v)] were placed on the right. Reproduced with permission from E. L. Papadopoulou et al., Tissue Eng Part C Methods 16, 497 (2010). Copyright 2010. Mary Ann Liebert.

Similar articles

Cited by

References

    1. Stratakis E. and Zorba V., in Biomimetic and Bioinspired Nanomaterials, Nanomaterials for the Life Sciences Vol. 7, edited by Kumar C. S. S. R. (Wiley, Weinheim, 2010), Chap. 11.
    1. Xia F. and Jiang L., Adv. Mater. (Weinheim, Ger.) ADVMEW 20, 2842 (2008).10.1002/adma.200800836 - DOI
    1. Shiu J. -Y., Kuo C. -W., Chen P., and Mou C. -Y., Chem. Mater. CMATEX 16, 561 (2004).10.1021/cm034696h - DOI
    1. Bartlett P. N., Baumberg J. J., Birkin P. R., Ghanem M. A., and Netti M. C., Chem. Mater. CMATEX 14, 2199 (2002).10.1021/cm011272j - DOI
    1. Woodward I., Schofield W. C. E., Roucoules V., and Badyal J. P. S., Langmuir LANGD5 19, 3432 (2003).10.1021/la020427e - DOI

LinkOut - more resources