

Development of a MR-visible compound for tracing neuroanatomical connections in vivo
- PMID: 21521610
- PMCID: PMC3419536
- DOI: 10.1016/j.neuron.2011.03.010
Development of a MR-visible compound for tracing neuroanatomical connections in vivo
Abstract
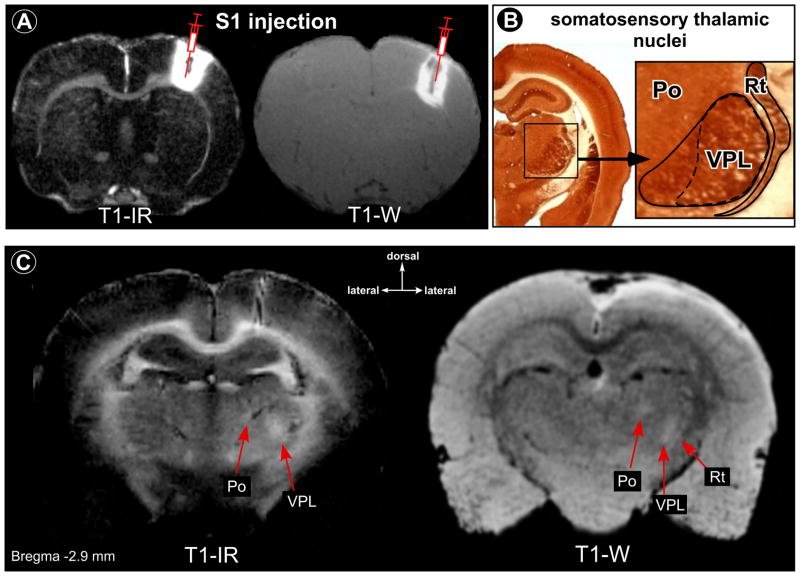
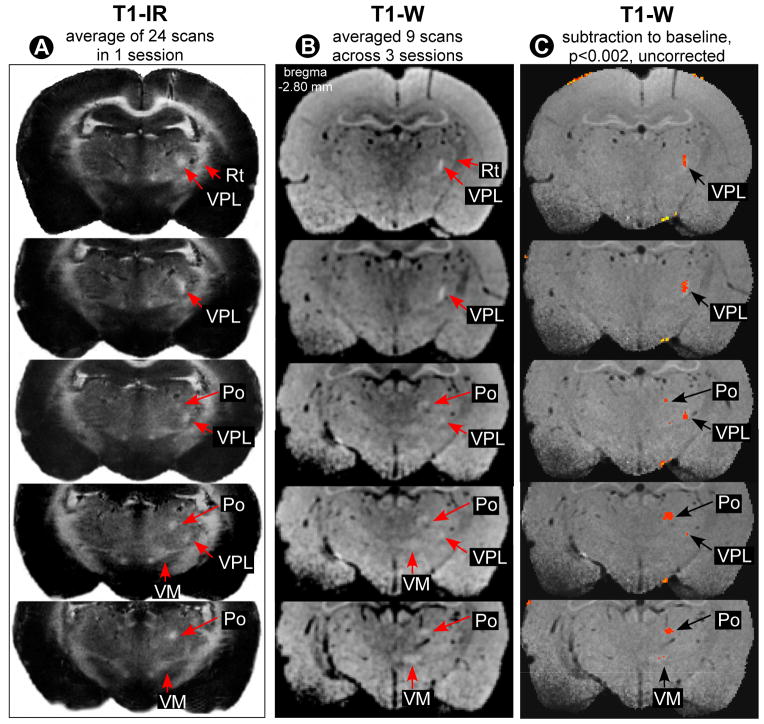
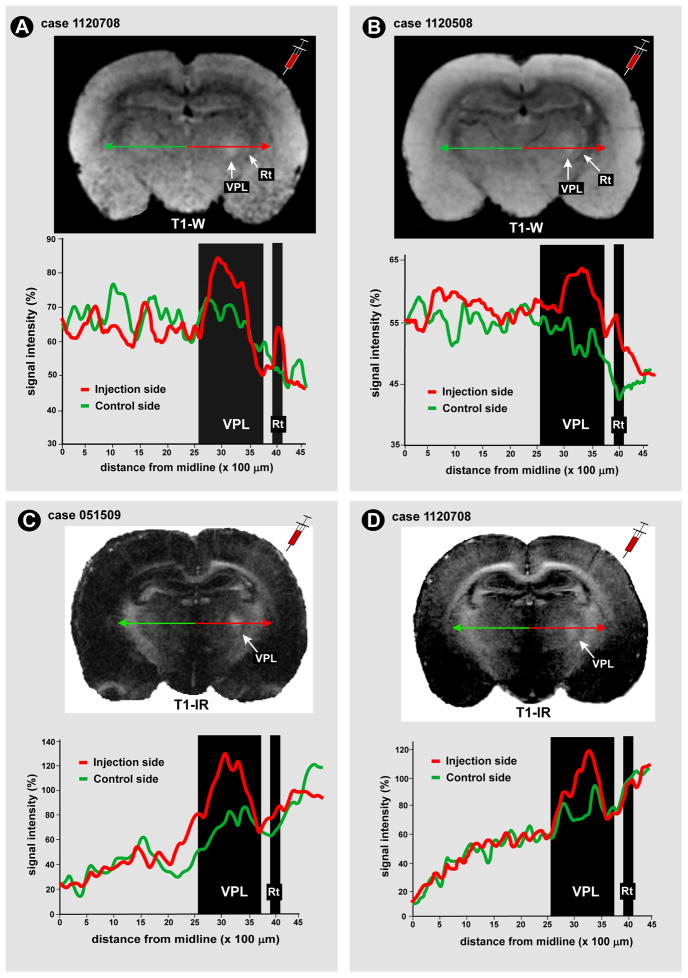
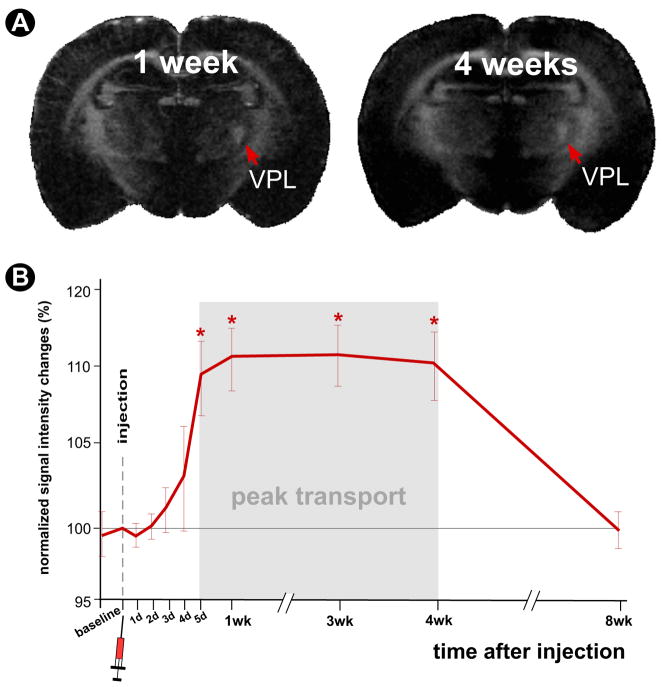
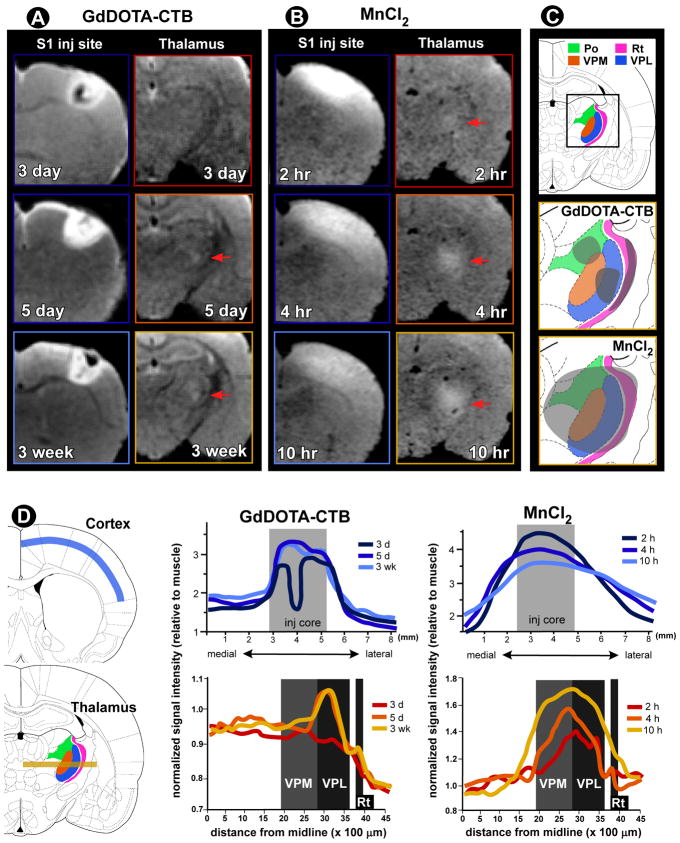
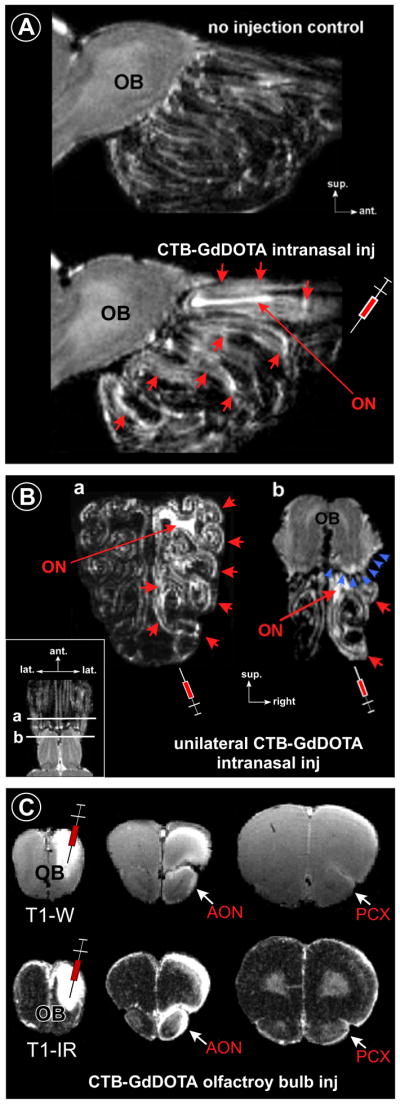
Traditional studies of neuroanatomical connections require injection of tracer compounds into living brains, then histology of the postmortem tissue. Here, we describe and validate a compound that reveals neuronal connections in vivo, using MRI. The classic anatomical tracer CTB (cholera-toxin subunit-B) was conjugated with a gadolinium-chelate to form GdDOTA-CTB. GdDOTA-CTB was injected into the primary somatosensory cortex (S1) or the olfactory pathway of rats. High-resolution MR images were collected at a range of time points at 11.7T and 7T. The transported GdDOTA-CTB was visible for at least 1 month post-injection, clearing within 2 months. Control injections of non-conjugated GdDOTA into S1 were not transported and cleared within 1-2 days. Control injections of Gd-Albumin were not transported either, clearing within 7 days. These MR results were verified by classic immunohistochemical staining for CTB, in the same animals. The GdDOTA-CTB neuronal transport was target specific, monosynaptic, stable for several weeks, and reproducible.
Copyright © 2011 Elsevier Inc. All rights reserved.
Figures


Similar articles
-
Cholera Toxin B Subunit Shows Transneuronal Tracing after Injection in an Injured Sciatic Nerve.PLoS One. 2015 Dec 7;10(12):e0144030. doi: 10.1371/journal.pone.0144030. eCollection 2015. PLoS One. 2015. PMID: 26640949 Free PMC article.
-
Layer specific tracing of corticocortical and thalamocortical connectivity in the rodent using manganese enhanced MRI.Neuroimage. 2009 Feb 1;44(3):923-31. doi: 10.1016/j.neuroimage.2008.07.036. Epub 2008 Jul 29. Neuroimage. 2009. PMID: 18755280 Free PMC article.
-
Cholera toxin B-gold, a retrograde tracer that can be used in light and electron microscopic immunocytochemical studies.J Comp Neurol. 1990 Apr 8;294(2):179-91. doi: 10.1002/cne.902940203. J Comp Neurol. 1990. PMID: 1692043
-
Reciprocal and topographic connections between the piriform and prefrontal cortices in the rat: a tracing study using the B subunit of the cholera toxin.Brain Res Bull. 1996;41(6):391-8. doi: 10.1016/s0361-9230(96)00082-2. Brain Res Bull. 1996. PMID: 8973845
-
Re: Woolsey TA, van der Loos H. 1970. The structural organization of layer IV in the somatosensory region (S I) of mouse cerebral cortex. Brain Res. 17: 205-242.Brain Res. 2016 Aug 15;1645:22-4. doi: 10.1016/j.brainres.2016.04.029. Epub 2016 Apr 14. Brain Res. 2016. PMID: 27086973 Review.
Cited by
-
Metalloprotein-based MRI probes.FEBS Lett. 2013 Apr 17;587(8):1021-9. doi: 10.1016/j.febslet.2013.01.044. Epub 2013 Jan 31. FEBS Lett. 2013. PMID: 23376346 Free PMC article. Review.
-
Bioengineered probes for molecular magnetic resonance imaging in the nervous system.ACS Chem Neurosci. 2012 Aug 15;3(8):593-602. doi: 10.1021/cn300059r. Epub 2012 Jul 11. ACS Chem Neurosci. 2012. PMID: 22896803 Free PMC article. Review.
-
A Student's Guide to Neural Circuit Tracing.Front Neurosci. 2019 Aug 27;13:897. doi: 10.3389/fnins.2019.00897. eCollection 2019. Front Neurosci. 2019. PMID: 31507369 Free PMC article. Review.
-
Genetic control of MRI contrast using the manganese transporter Zip14.Magn Reson Med. 2024 Aug;92(2):820-835. doi: 10.1002/mrm.29993. Epub 2024 Apr 4. Magn Reson Med. 2024. PMID: 38573932
-
Trivalent Gd-DOTA reagents for modification of proteins.RSC Adv. 2015 Dec 9;5(116):96194-96200. doi: 10.1039/c5ra20359g. Epub 2015 Nov 11. RSC Adv. 2015. PMID: 27019702 Free PMC article.
References
-
- Akers RM, Killackey HP. Organization of corticocortical connections in the parietal cortex of the rat. J Comp Neurol. 1978;181:513–537. - PubMed
-
- Alitto HJ, Usrey WM. Corticothalamic feedback and sensory processing. Curr Opin Neurobiol. 2003;13:440–445. - PubMed
-
- Angelucci A, Clasca F, Sur M. Anterograde axonal tracing with the subunit B of cholera toxin: a highly sensitive immunohistochemical protocol for revealing fine axonal morphology in adult and neonatal brains. J Neurosci Methods. 1996;65:101–112. - PubMed
-
- Aoki I, Naruse S, Tanaka C. Manganese-enhanced magnetic resonance imaging (MEMRI) of brain activity and applications to early detection of brain ischemia. NMR Biomed. 2004;17:569–580. - PubMed
-
- Aoki I, Tanaka C, Takegami T, Ebisu T, Umeda M, Fukunaga M, Fukuda K, Silva AC, Koretsky AP, Naruse S. Dynamic activity-induced manganese-dependent contrast magnetic resonance imaging (DAIM MRI) Magn Reson Med. 2002;48:927–933. - PubMed
Publication types
MeSH terms
Substances
Grants and funding
LinkOut - more resources
Full Text Sources
Other Literature Sources
Medical
