The obese brain: association of body mass index and insulin sensitivity with resting state network functional connectivity
- PMID: 21520345
- PMCID: PMC6870244
- DOI: 10.1002/hbm.21268
The obese brain: association of body mass index and insulin sensitivity with resting state network functional connectivity
Abstract
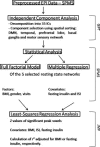
Obesity is a key risk factor for the development of insulin resistance, Type 2 diabetes and associated diseases; thus, it has become a major public health concern. In this context, a detailed understanding of brain networks regulating food intake, including hormonal modulation, is crucial. At present, little is known about potential alterations of cerebral networks regulating ingestive behavior. We used "resting state" functional magnetic resonance imaging to investigate the functional connectivity integrity of resting state networks (RSNs) related to food intake in lean and obese subjects using independent component analysis. Our results showed altered functional connectivity strength in obese compared to lean subjects in the default mode network (DMN) and temporal lobe network. In the DMN, obese subjects showed in the precuneus bilaterally increased and in the right anterior cingulate decreased functional connectivity strength. Furthermore, in the temporal lobe network, obese subjects showed decreased functional connectivity strength in the left insular cortex. The functional connectivity magnitude significantly correlated with body mass index (BMI). Two further RSNs, including brain regions associated with food and reward processing, did not show BMI, but insulin associated functional connectivity strength. Here, the left orbitofrontal cortex and right putamen functional connectivity strength was positively correlated with fasting insulin levels and negatively correlated with insulin sensitivity index. Taken together, these results complement and expand previous functional neuroimaging findings by demonstrating that obesity and insulin levels influence brain function during rest in networks supporting reward and food regulation.
Copyright © 2011 Wiley-Liss, Inc.
Figures


Similar articles
-
Resting-state functional connectivity of brain regions involved in cognitive control, motivation, and reward is enhanced in obese females.Am J Clin Nutr. 2014 Aug;100(2):524-31. doi: 10.3945/ajcn.113.080671. Epub 2014 Jun 25. Am J Clin Nutr. 2014. PMID: 24965310 Clinical Trial.
-
Obesity is marked by distinct functional connectivity in brain networks involved in food reward and salience.Behav Brain Res. 2015;287:127-34. doi: 10.1016/j.bbr.2015.03.016. Epub 2015 Mar 14. Behav Brain Res. 2015. PMID: 25779924
-
The neural substrates of subliminal attentional bias and reduced inhibition in individuals with a higher BMI: A VBM and resting state connectivity study.Neuroimage. 2021 Apr 1;229:117725. doi: 10.1016/j.neuroimage.2021.117725. Epub 2021 Jan 20. Neuroimage. 2021. PMID: 33484850
-
The structural and functional connectivity of the posterior cingulate cortex: comparison between deterministic and probabilistic tractography for the investigation of structure-function relationships.Neuroimage. 2014 Nov 15;102 Pt 1:118-27. doi: 10.1016/j.neuroimage.2013.12.022. Epub 2013 Dec 21. Neuroimage. 2014. PMID: 24365673 Review.
-
[Resting state functional MRI of the brain].Nervenarzt. 2014 Jun;85(6):690-700. doi: 10.1007/s00115-014-4013-y. Nervenarzt. 2014. PMID: 24849117 Review. German.
Cited by
-
Stress as a common risk factor for obesity and addiction.Biol Psychiatry. 2013 May 1;73(9):827-35. doi: 10.1016/j.biopsych.2013.01.032. Epub 2013 Mar 26. Biol Psychiatry. 2013. PMID: 23541000 Free PMC article. Review.
-
Functional Connectivity During Handgrip Motor Fatigue in Older Adults Is Obesity and Sex-Specific.Front Hum Neurosci. 2018 Nov 13;12:455. doi: 10.3389/fnhum.2018.00455. eCollection 2018. Front Hum Neurosci. 2018. PMID: 30483085 Free PMC article.
-
Identification of a brain fingerprint for overweight and obesity.Physiol Behav. 2020 Aug 1;222:112940. doi: 10.1016/j.physbeh.2020.112940. Epub 2020 May 14. Physiol Behav. 2020. PMID: 32417645 Free PMC article.
-
Food related processes in the insular cortex.Front Hum Neurosci. 2013 Aug 23;7:499. doi: 10.3389/fnhum.2013.00499. eCollection 2013. Front Hum Neurosci. 2013. PMID: 23986683 Free PMC article.
-
A decline in inflammation is associated with less depressive symptoms after a dietary intervention in metabolic syndrome patients: a longitudinal study.Nutr J. 2014 Apr 24;13:36. doi: 10.1186/1475-2891-13-36. Nutr J. 2014. PMID: 24762259 Free PMC article. Clinical Trial.
References
-
- Aharon I, Etcoff N, Ariely D, Chabris CF, O'Connor E, Breiter HC ( 2001): Beautiful faces have variable reward value: fMRI and behavioral evidence. Neuron 32: 537–551. - PubMed
-
- Ashburner J, Friston KJ ( 2005): Unified segmentation. Neuroimage 26: 839–851. - PubMed
-
- Bell AJ, Sejnowski TJ ( 1995): An information‐maximization approach to blind separation and blind deconvolution. Neural Comput 7: 1129–1159. - PubMed
Publication types
MeSH terms
LinkOut - more resources
Full Text Sources
Medical

