. 2011 May 15;186(10):5772-83.
doi: 10.4049/jimmunol.1003192. Epub 2011 Apr 15.

TLR4 signaling via MyD88 and TRIF differentially shape the CD4+ T cell response to Porphyromonas gingivalis hemagglutinin B

Affiliations

TLR4 signaling via MyD88 and TRIF differentially shape the CD4+ T cell response to Porphyromonas gingivalis hemagglutinin B

Dalia E Gaddis et al. J Immunol. .

Abstract

Recombinant hemagglutinin B (rHagB), a virulence factor of the periodontal pathogen Porphyromonas gingivalis, has been shown to induce protective immunity against bacterial infection. Furthermore, we have demonstrated that rHagB is a TLR4 agonist for dendritic cells. However, it is not known how rHagB dendritic cell stimulation affects the activation and differentiation of T cells. Therefore, we undertook the present study to examine the role of TLR4 signaling in shaping the CD4(+) T cell response following immunization of mice with rHagB. Immunization with this Ag resulted in the induction of specific CD4(+) T cells and Ab responses. In TLR4(-/-) and MyD88(-/-) but not Toll/IL-1R domain-containing adapter inducing IFN-β-deficient (TRIF(Lps2)) mice, there was an increase in the Th2 CD4(+) T cell subset, a decrease in the Th1 subset, and higher serum IgG(1)/IgG(2) levels of HagB-specific Abs compared with those in wild-type mice. These finding were accompanied by increased GATA-3 and Foxp3 expression and a decrease in the activation of CD4(+) T cells isolated from TLR4(-/-) and MyD88(-/-) mice. Interestingly, TLR4(-/-) CD4(+) T cells showed an increase in IL-2/STAT5 signaling. Whereas TRIF deficiency had minimal effects on the CD4(+) T cell response, it resulted in increased IFN-γ and IL-17 production by memory CD4(+) T cells. To our knowledge, these results demonstrate for the first time that TLR4 signaling, via the downstream MyD88 and TRIF molecules, exerts a differential regulation on the CD4(+) T cell response to HagB Ag. The gained insight from the present work will aid in designing better therapeutic strategies against P. gingivalis infection.


Conflict of interest statement

Disclosures

The authors have no financial conflicts of interest.

Figures
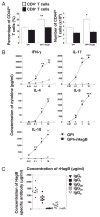
FIGURE 1
FIGURE 1
Immunization of WT mice with rHagB and GPI results in a specific CD4+ T cell and Ab response. WT mice were immunized as described above and analyzed 21 d following immunization. A, Expression of CD44 on CD4+ (open bars) or CD8+ (filled bars) T cells ex vivo in immunized and control mice. Graphs represent percentages and numbers of CD44hi T cells. Results are expressed as the mean ± SE of three individual mice from one of three independent experiments. B, Cytokine production by purified CD4+ T cells from spleens and lymph nodes of immunized (squares) or control (triangles) mice. Equal numbers of purified CD4+ T cells and irradiated WT feeder cells were stimulated with 0.01, 0.1, 1, and 10 μg/ml rHagB. Culture supernatants were harvested 5 d later and assessed for the levels of IFN-γ, IL-17, IL-4, IL-5, and IL-10 by ELISA. Results are expressed as the mean ± SE of triplicate wells from one of at least three independent experiments. C, Serum HagB-specific Ab levels showing IgGT and subclasses IgG1, IgG2b, IgG2c and IgG3. Each symbol represents an individual mouse (n = 9), and the horizontal lines represent the mean of the response. ***p < 0.001, **p < 0.01, *p < 0.05 compared with control groups.
FIGURE 2
FIGURE 2
TLR4 shapes the development of rHagB-specific Th1 and Th2 CD4+ T cell responses. A, Cytokine production by splenic and lymph node-purified CD4+ T cells from WT or TLR4−/− immunized (squares) or control (triangles) mice 21 or 42 d following immunization. Cells were stimulated with 0.01, 0.1, 1, and 10 μg/ml rHagB, and culture supernatants were harvested and assessed for cytokines as previously described (see Materials and Methods). Results are expressed as the mean ± SE of triplicate cultures from one of three independent experiments. B, IFN-γ production by intracellular cytokine staining. Cells were stimulated with 10 μg/ml rHagB or left unstimulated as controls for 36 h and cytokine secretion was blocked for an additional 10 h. IFN-γ production was detected by intracellular cytokine staining. Numbers represent percentages of CD4+ T cells that produce IFN-γ. C, Serum levels of rHagB-specific IgG1, IgG2b, and IgG2c from immunized WT and TLR4 −/− mice. Each symbol represents an individual mouse and the horizontal lines represent the mean of the response. D, Ratio of HagB-specific IgG1/IgG2b+2c in serum of WT and TLR4−/− mice. Ratios of IgG1 to IgG2b+2c were calculated for each individual mouse sample in C prior to the calculation of the mean and SE. ***p < 0.001, **p < 0.01, *p < 0.05 compared with control groups.
FIGURE 3
FIGURE 3
MyD88 and TRIF differentially regulate the CD4+ T cell response toward rHagB following immunization. A, Cytokine production by splenic and lymph node-purified CD4+ T cells from WT, MyD88−/−, or TRIFLps2 immunized or control mice 21 or 44 d following immunization. Cells were stimulated as previously described (see Materials and Methods) and culture supernatants were harvested 5 d later and assessed for the levels of IFN-γ, IL-17, IL-4, IL-5, and IL-10 by ELISA. Results are expressed as the mean ± SE of triplicate cultures from one of three independent experiments. B, IFN-γ production by intracellular cytokine staining. CD4+ T cells from WT, MyD88−/−, or TRIFLps2 were stimulated with 10 μg/ml rHagB or left unstimulated as controls for 36 h and cytokine secretion was blocked for an additional 10 h. IFN-γ production was detected by intracellular cytokine staining. Numbers represent percentages of CD4+ T cells that produce IFN-γ. C, Serum levels of rHagB-specific IgG1, IgG2b, and IgG2c from WT, MyD88−/−, and TRIFLps2 mice. Each symbol represents an individual mouse and the horizontal lines represent the mean of the response. D, Ratio of rHagB-specific IgG1/IgG2b+2c in serum of WT, MyD88−/−, and TRIFLps2 mice. Ratios of IgG1 to IgG2b+2c were calculated for each individual mouse sample in C prior to the calculation of the mean and SE. ***p < 0.001, **p < 0.01, *p < 0.05 compared with control groups.
FIGURE 4
FIGURE 4
TLR4 signaling regulates the expression of T-bet and GATA-3. Expression of T-bet, GATA-3, and RORγt by rHagB-stimulated purified CD4+ T cells from spleens and lymph nodes of WT and TLR4−/− (A) or WT, MyD88−/−, and TRIFLps2 (B) immunized or control mice 21 d following immunization. Cells were stimulated with rHagB (10 μg/ml) or left unstimulated as controls. Cells were harvested at 36 h poststimulation and stained with CD4, CD25, T-bet, GATA-3, or RORγt Abs. Numbers represent the percentage of activated CD25+CD4+ T cells that express a particular transcription factor. Results are expressed as the mean ± SE of two to four independent experiments. ***p < 0.001, **p < 0.01, *p < 0.05 compared with unstimulated cultures from rHagB immunized mice; #p < 0.05 compared with stimulated cultures from rHagB immunized mice.
FIGURE 5
FIGURE 5
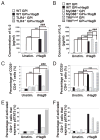
Lack of TLR4 results in an increase in IL-2 signaling following rHagB stimulation. A and B, IL-2 production by rHagB-stimulated purified CD4+ T cells from spleens and lymph nodes of WT and TLR4−/− (A, C, E) or WT, MyD88−/−, and TRIFLps2 (B, D, F) immunized or control mice 21 d following immunization. Cells were stimulated with rHagB (10 μg/ml) or left unstimulated as controls. Culture supernatants were harvested 36 h poststimulation and were assessed for the levels of IL-2 by ELISA. Results are expressed as the mean ± SE of triplicate cultures from one of two independent experiments. C and D, Expression of CD25 (IL-2Rα) by rHagB-stimulated CD4+ T cells. Cells were stimulated with rHagB (10 μg/ml) or left unstimulated as controls, harvested at 36 h following stimulation, and stained with CD4 and CD25 Abs. Numbers represent the percentages of CD25+CD4+ T cells. Results are expressed as the mean ± SE of at least triplicate cultures from two to four independent experiments. (E, F) Expression of pSTAT5 by rHagB stimulated purified splenic and lymph node CD4+ T cells. Cells were stimulated as above, harvested at 36 h poststimulation and stained with CD4, CD69 and pSTAT5 Abs. Numbers represent percentages of activated CD69+CD4+ T cells that express pSTAT5. Results represent one of two independent experiments. ***p < 0.001, compared with unstimulated cultures from HagB immunized mice; ###p < 0.001, ##p < 0.01 compared with HagB-stimulated cultures from HagB immunized mice.
FIGURE 6
FIGURE 6
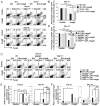
Activated CD4+ T cells that lack TLR4 or MyD88 express high levels of Foxp3 and TRIFLps2 CD4+ T cells express an increased ratio of T-bet and RORγt to Foxp3 44 d following rHagB immunization. Expression of Foxp3 by rHagB-stimulated purified CD4+ T cells from WT and TLR4−/− (A, B) or WT, MyD88−/−, and TRIFLps2 (C, D) immunized or control mice 21, 42, or 44 d following immunization. Cells were stimulated with rHagB (10 μg/ml) or left unstimulated as controls, harvested at 36 h poststimulation, and stained with CD4, CD25, and Foxp3 Abs. A and C, Flow cytometry dot plots gated on CD4+ T cells showing the percentages of cells expressing CD25 and Foxp3. Results represent one of two or three individual experiments. B and D, Numbers represent the percentages of CD25+CD4+ T cells that express Foxp3. Results are expressed as the mean ± SE of two or three independent experiments. E and F, Purified CD4+ T cells from immunized or control WT, MyD88−/−, and TRIFLps2 were stimulated with rHagB and the expression of T-bet, RORγt, and Foxp3 was assessed as described previously. Ratio of T-bet/Foxp3 (E) or RORγt/Foxp3 (F) expressed by activated CD4+ T cells 21 and 44 d following immunization is shown. Results are expressed as the mean ± SE of three to five independent experiments. ***p < 0.001, **p < 0.01, *p < 0.05 compared with unstimulated cultures from rHagB immunized mice; ###p < 0.001, ##p < 0.01, #p < 0.05 compared with rHagB-stimulated cultures from HagB immunized mice.
FIGURE 7
FIGURE 7
TLR4 signaling differentially regulates CD69 expression. Expression of CD69 by rHagB-stimulated purified splenic and lymph node CD4+ T cells from WT and TLR4−/− (A) or WT, MyD88−/−, and TRIFLps2 (B) immunized or control mice 21, 42, or 44 d following immunization. Cells were stimulated with rHagB (10 μg/ml) or left unsti-mulated as controls, harvested at 36 h poststimulation, and stained with CD4 and CD69 Abs. Numbers represent the percentages of CD69+CD4+ T cells. Results are expressed as the mean ± SE of at least triplicate cultures from two to four independent experiments. ***p < 0.001 compared with unstimulated cultures from rHagB immunized mice; #p < 0.05 compared with rHagB-stimulated cultures from rHagB immunized mice.
FIGURE 8
FIGURE 8
The lack of TLR4 results in a decrease in the proliferation capacity of CD4+ T cells. CFSE-labeled CD4+ T cells from WT and TLR4−/− (A) or WT, MyD88−/−, and TRIFLps2 (B) immunized or control mice 21 d following immunization. Cells were stimulated with rHagB (10 μg/ml) or left unstimulated as controls, harvested 5 d poststimulation, and stained with CD4 Abs. Histogram plots gated on CD4+ T cells show the percentages of cells that diluted CFSE. Results are expressed as the mean ± SE of at least triplicate cultures from two or three individual experiments.
FIGURE 9
FIGURE 9
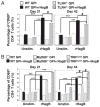
TLR4 differentially regulates CTLA-4 expression on CD4+ T cells. Expression of CTLA-4 on CD4+ T cells ex vivo from WT and TLR4−/− (A) or WT, MyD88−/−, and TRIFLps2 (B) immunized or control mice 21 d following immunization. Numbers represent percentages of CD4+ T cells expressing CTLA-4. Results are expressed as the mean ± SE of one of two or three individual experiments. *p < 0.05 compared with control groups; #p < 0.05 compared with WT rHagB immunized mice.

Similar articles

Cited by

References

    1. Lamont RJ, Jenkinson HF. Life below the gum line: pathogenic mechanisms of Porphyromonas gingivalis. Microbiol Mol Biol Rev. 1998;62:1244–1263. - PMC - PubMed
    1. Socransky SS, Haffajee AD, Cugini MA, Smith C, Kent RL., Jr Microbial complexes in subgingival plaque. J Clin Periodontol. 1998;25:134–144. - PubMed
    1. Slots J, Bragd L, Wikström M, Dahlén G. The occurrence of Actinobacillus actinomycetemcomitans, Bacteroides gingivalis and Bacteroides intermedius in destructive periodontal disease in adults. J Clin Periodontol. 1986;13:570–577. - PubMed
    1. López NJ. Occurrence of Actinobacillus actinomycetemcomitans, Porphyromonas gingivalis, and Prevotella intermedia in progressive adult periodontitis. J Periodontol. 2000;71:948–954. - PubMed
    1. Beck J, Garcia R, Heiss G, Vokonas PS, Offenbacher S. Periodontal disease and cardiovascular disease. J Periodontol. 1996;67(10, Suppl):1123–1137. - PubMed

Publication types

MeSH terms