. 2011 May;13(5):589-98.
doi: 10.1038/ncb2220. Epub 2011 Apr 10.

During autophagy mitochondria elongate, are spared from degradation and sustain cell viability

Affiliations

During autophagy mitochondria elongate, are spared from degradation and sustain cell viability

Ligia C Gomes et al. Nat Cell Biol. 2011 May.

Abstract

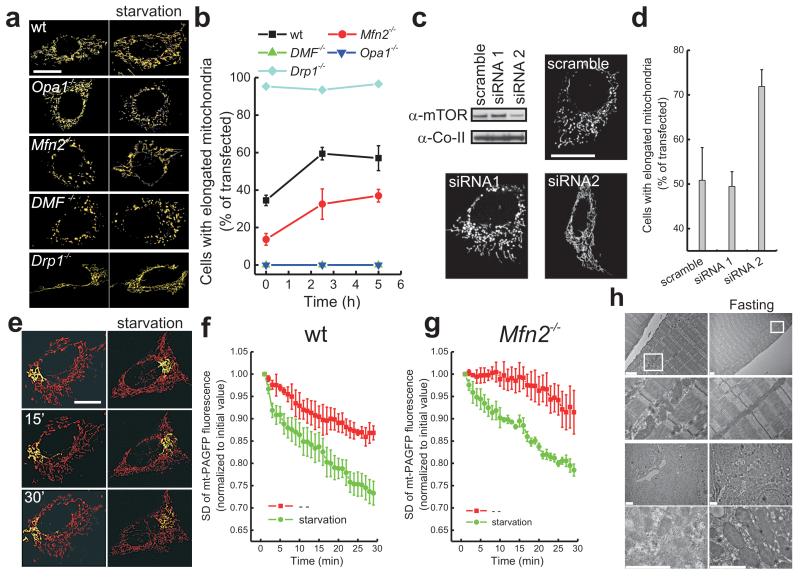
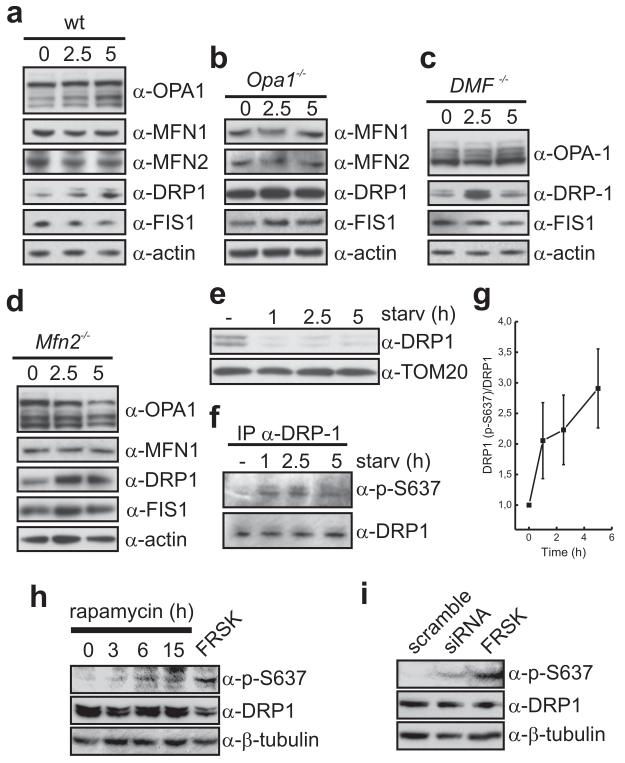
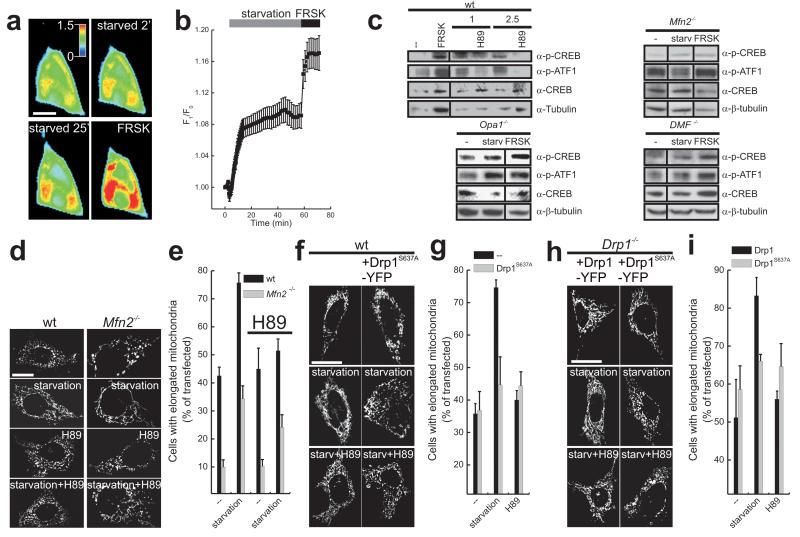
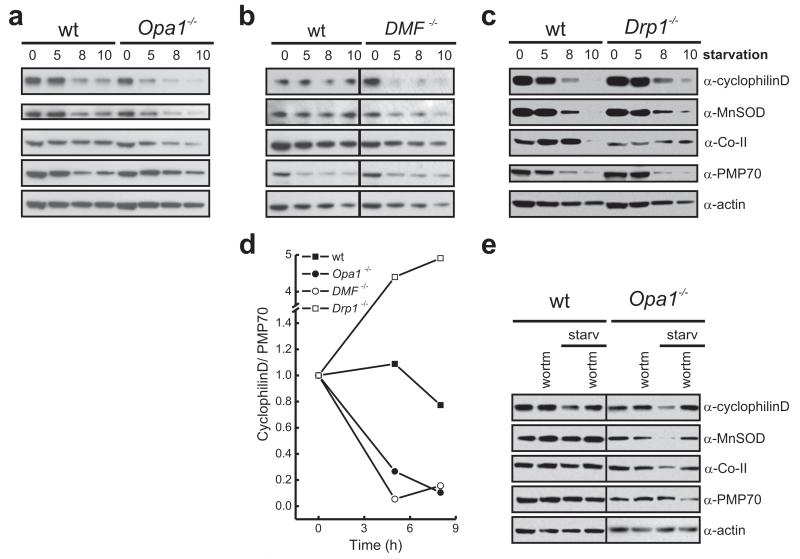
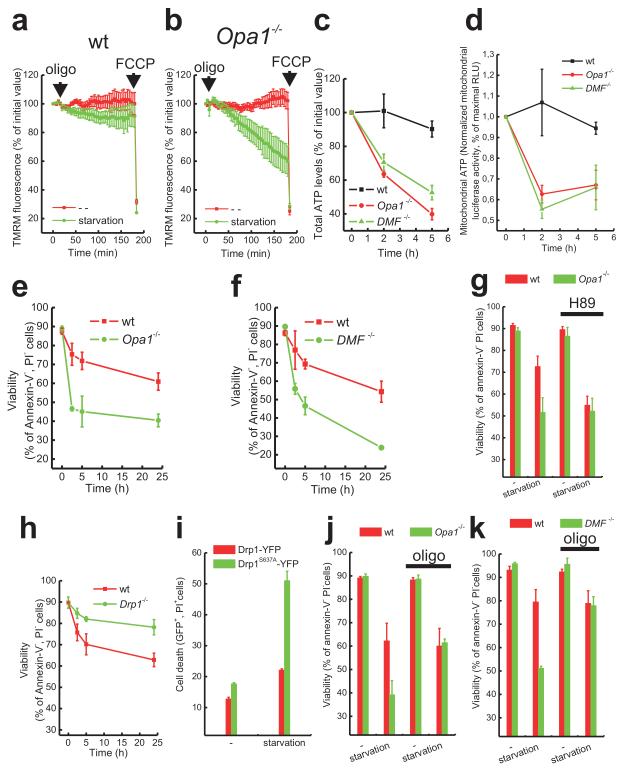
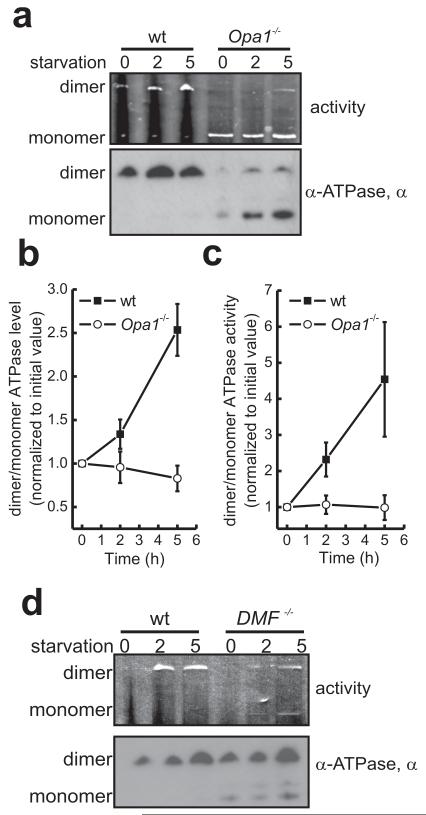
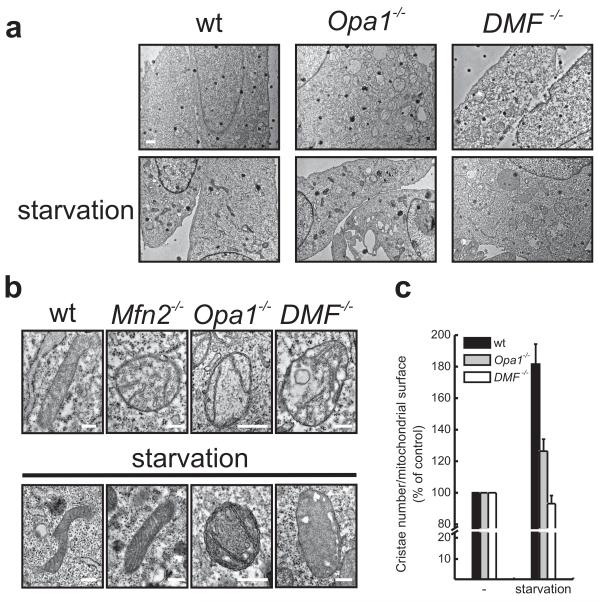
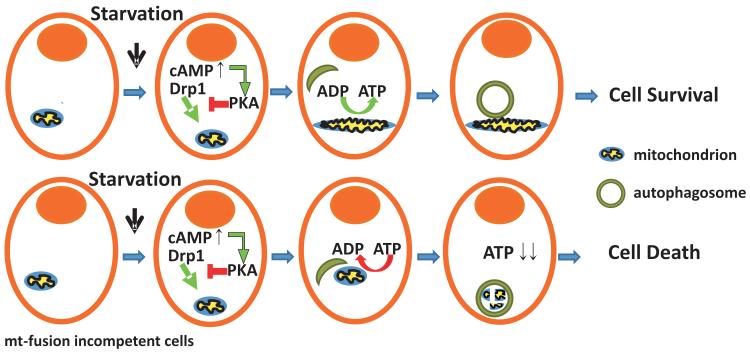
A plethora of cellular processes, including apoptosis, depend on regulated changes in mitochondrial shape and ultrastructure. The role of mitochondria and of their morphology during autophagy, a bulk degradation and recycling process of eukaryotic cells' constituents, is not well understood. Here we show that mitochondrial morphology determines the cellular response to macroautophagy. When autophagy is triggered, mitochondria elongate in vitro and in vivo. During starvation, cellular cyclic AMP levels increase and protein kinase A (PKA) is activated. PKA in turn phosphorylates the pro-fission dynamin-related protein 1 (DRP1), which is therefore retained in the cytoplasm, leading to unopposed mitochondrial fusion. Elongated mitochondria are spared from autophagic degradation, possess more cristae, increased levels of dimerization and activity of ATP synthase, and maintain ATP production. Conversely, when elongation is genetically or pharmacologically blocked, mitochondria consume ATP, precipitating starvation-induced death. Thus, regulated changes in mitochondrial morphology determine the fate of the cell during autophagy.


Figures

Figure 1
Figure 1. Mitochondrial elongation in response to autophagy
(a) Representative confocal images of mitochondrial morphology in MEFs of the indicated genotype 24 hrs following transfection with mtYFP. Where indicated, cells were starved for 2.5 hrs. Bar, 20 μm (b) Morphometric analysis of mitochondrial shape. Experiments were carried exactly as in (a). Data represent mean ± SEM of 3 independent experiments (n=100 cells per condition in each experiment). (c) Forty-eight hrs after transfection with the indicated siRNA MEFs were lysed and 25 μg of proteins were separated by SDS-PAGE and immunoblotted with the indicated antibodies. Representative images show mitochondrial morphology of MEFs transfected with the indicated siRNA and after 24 hrs with mtYFP. After further 24 hrs confocal images were acquired. Bar, 20 μm. (d) Morphometric analysis of mitochondrial shape. Experiments were carried exactly as in (c). Data represent mean ± SEM of 5 independent experiments (n=100 cells per condition in each experiment). (e) Representative images of mitochondrial fusion. MEFs were co-transfected with mt-PAGFP and mtRFP and after 24 hrs, mt-PAGFP was photoactivated in a region of interest (box) and cells were imaged by real time confocal microscopy. Where indicated, MEFs were starved for 2.5 hrs. Bar, 20 μm. See also Supplementary Movies 1-2 (f-g) Quantification of mitochondrial fusion in MEFs of the indicated genotype. Experiments were carried exactly as in (e). Data represent mean ± SEM of 4 independent experiments. (h) Representative electron micrographs of muscle (longitudinal sections) and liver from CD1 mice. Where indicated, mice were fasted for 12 hrs. Magnifications of boxed regions are presented below. Bar, 2 μm.
Figure 2
Figure 2. Increased phosphorylation of Ser637 of DRP1 during autophagy
(a-d) Levels of mitochondria-shaping proteins during starvation. Twenty μg of proteins from MEFs of the indicated genotype were separated by SDS-PAGE and immunoblotted with the indicated antibodies. Where indicated, cells were starved for the indicated times. (e) Association of DRP1 with mitochondria upon starvation. Mitochondria were isolated from MEFs starved for the indicated times and 25 μg of proteins were separated by SDS-PAGE and immunoblotted with the indicated antibodies. (f) Levels of Ser-637 phosphorylation of DRP1 during starvation. Equal amounts of cell lysates from wt MEFs starved for the indicated times were immunoprecipitated with the indicated antibody and the immunoprecipitated proteins were separated by SDS-PAGE and immunoblotted with the indicated antibodies. (g) Quantitative analysis of Ser-637 phosphorylation of DRP1 during starvation. Experiments were as in (l). Data are normalized to total levels of DRP1 and represent the mean ±SEM of 3 independent experiments. (h) MEFs were treated for the indicated times with 100 nM rapamycin or with 25 μM forskolin for 0.5 hrs, lysed and equal amounts (50 μg) of proteins were separated by SDS-PAGE and immunoblotted using the indicated antibodies. (i) HeLa cells were transfected for 2 days with the indicated siRNA or treated with 25 μM forskolin for 0.5 hrs and lysed. Equal amounts (50 μg) of proteins were separated by SDS-PAGE and immunoblotted using the indicated antibodies. Uncropped images of all blots in this figure are shown in Supplementary Information, Fig. S8.
Figure 3
Figure 3. Mitochondrial elongation during starvation is mediated by the cAMP-PKA axis
(a) Pseudocolor-coded images of EpacI-camps FRET from real time imaging of wt MEFs transfected with EpacI-camps. Where indicated, cells where perfused with the starvation solution for the indicated times or with 25 μM forskolin. Bar, 20 μm. See also Supplementary Movie 3 (b) Quantitative analysis of CFP/YFP FRET ratio. Experiments were as in (a). Where indicated, cells were perfused with the starvation solution or with 25 μM forskolin. Data represent mean ± SEM of 13 independent experiments. (c) Fifty μg of lysates of MEFs of the indicated genotypes were analyzed by SDS-PAGE/immunoblotting using the indicated antibodies. Where indicated, MEFs were starved, or treated with 25 μM forskolin (FRSK). Where indicated, 20 μM H89 was added during starvation. Uncropped images of all blots in this figure are shown in Supplementary Information, Fig. S8. (d) Representative images of the effect of H89 on mitochondrial morphology upon starvation. wt and Mfn2−/− MEFs were transfected with mtYFP, and after 24 hrs confocal images were acquired. Where indicated, cells were starved for 2.5 hrs and 20 μM H89 was added. Bar, 20 μm. (e) Morphometric analysis. Experiments were carried exactly as in (d). Data represent mean ± SEM of 5 independent experiments (n=100 cells per condition). (f) Starvation-induced mitochondrial elongation depends on Ser 637 of DRP1. Representative confocal images of mitochondrial morphology of wt MEFs co-transfected with mtRFP and the indicated plasmids. Twenty-four hrs after transfection, where indicated cells were starved for 2.5 hrs and imaged. Where indicated, 20 μM H89 was present during starvation. Bar, 20 μm. (g) Morphometric analysis of mitochondrial shape. Experiments were as in (f). Data represent mean ± SEM of 5 independent experiments (n= 50 cells per condition). (h) Representative confocal images of mitochondrial morphology of Drp1−/− MEFs co-transfected with mtRFP and the indicated plasmids. Twenty-four hrs after transfection, where indicated cells were starved for 2.5 hrs and imaged. Where indicated, 20 μM H89 was present during starvation. Bar, 20 μm. (i) Morphometric analysis of mitochondrial shape. Experiments were as in (h). Data represent mean ± SEM of 5 independent experiments (n= 50 cells per condition).
Figure 4
Figure 4. Elongated mitochondria are spared from degradation during starvation
(a-c) MEFs of the indicated genotype were treated as indicated, counted and 2.7×10⁵ cells were lysed. Lysates were separated by SDS-PAGE and immunoblotted using the indicated antibodies. (d) Ratio between the densitometric levels of cyclophilin D and those of PMP70 in MEFs of the indicated genotype. One representative experiment of 5 independent repetitions carried as in (a-c) is shown. (e) MEFs of the indicated genotype starved for 5h were treated where indicated with 0.5 μM wortmannin (wortm). Lysates from 2.7×10⁵ cells were separated by SDS-PAGE and immunoblotted with the indicated antibodies. Uncropped images of all blots in this figure are shown in Supplementary Information, Fig. S8.
Figure 5
Figure 5. Mitochondrial elongation sustains cellular ATP production and viability during autophagy
(a,b) Quantitative analysis of TMRM fluorescence changes over mitochondrial regions in MEFs of the indicated genotype. Where indicated, cells were starved for 5 hrs prior to TMRM loading. Where indicated (arrows), 2.5 μg/ml oligomycin and 2 μM FCCP were added. Data represent mean ± SEM of 7 independent experiments. (c) Total cellular ATP levels were measured in cells of the indicated genotype starved for the indicated times. Data represent mean ± SEM of 5 independent experiments. (d) Mitochondrial ATP measured in situ by mitochondrially targeted luciferase in cells of the indicated genotype starved for the indicated times. Data represent mean ± SEM of 5 independent experiments and are normalized to the initial value. (e,f) Cells of the indicated genotype were starved for the indicated times and viability was determined by flow cytometry. Data represent mean ± SEM of 5 independent experiments. (g) MEFs of the indicated genotype were starved for 2.5 hrs. Where indicated, cells were treated with 20 μM H89. Viability was determined by flow cytometry. Data represent mean ± SEM of 5 independent experiments. (h) Cells of the indicated genotype were starved for the indicated times and viability was determined by flow cytometry. Data represent mean ± SEM of 5 independent experiments. (i) Drp1−/− MEFs were transfected with the indicated plasmids and after 24 hrs starved for 5 hrs where indicated. Viability was determined by flow cytometry. Data represent mean ± SEM of 4 independent experiments. (j,k) MEFs of the indicated genotype were starved for 5 hrs in the presence of 2.5μg/mL oligomycin where indicated and viability was determined cytofluorimetrically. Data represent mean ± SEM of 5 independent experiments.
Figure 6
Figure 6. Mitochondrial elongation during starvation is associated with dimerization and activation of ATPase
(a) Blue native electrophoresis analysis of ATPase dimerization and activity. Cells of the indicated genotype were treated as indicated and 500 μg of total cell extracts were solubilized with 4% digitonin and separated by BN-PAGE. ATPase activity was measured in gel (top) and ATPase levels were measured by immunoblotting for the indicated antibody (middle). (b-c) Quantitative analysis of levels (b) and activity (c) of the ratio between dimer and monomer of ATPase. Data represent mean ± SEM of 5 independent experiments carried as in (a). (d) Experiments were carried out as in (a), except that cells of the indicated genotype were used.
Figure 7
Figure 7. Density of cristae increases in mitochondria elongated during starvation
(a) Representative electron micrographs of cells of the indicated genotype starved where indicated for 5h, fixed and processed for electron microscopy. Bar 2 μm. (b) Representative electron micrographs of randomly selected mitochondria from cells of the indicated genotype. Where indicated, cells were starved for 5h. Bar, 0.5 μm. (c) Morphometric analysis of cristae density in cells of the indicated genotype. Experiments were as in (a). The number of the cristae in randomly selected 50 mitochondria of the indicated genotype was normalized for the calculated surface of the organelle. Data represent mean ± SEM of 5 independent experiments.
Figure 8
Figure 8. Mitochondrial elongation induced by PKA determines cell fate during starvation
The cartoon depicts the cascade of mitochondrial elongation triggered during starvation and its role in determining cell fate. Upper row: mitochondrial elongation protects from organelle degradation and allows maintenance of ATP levels. Lower row: when mitochondrial elongation is impaired, mitochondria are degraded and the remaining organelles consume cellular ATP, precipitating cell death.

Comment in

  • Autophagy: shaping the fate of mitochondria.
    Wrighton KH. Wrighton KH. Nat Rev Mol Cell Biol. 2011 Jun;12(6):344-5. doi: 10.1038/nrm3116. Epub 2011 Apr 29. Nat Rev Mol Cell Biol. 2011. PMID: 21527952 No abstract available.
  • Mitochondria unite to survive.
    Blackstone C, Chang CR. Blackstone C, et al. Nat Cell Biol. 2011 May;13(5):521-2. doi: 10.1038/ncb0511-521. Nat Cell Biol. 2011. PMID: 21540850

Similar articles

Cited by

References

    1. Hahn J, Voth M. Dynamics of mitochondria in living cells: shape changes, dislocations, fusion, and fission of mitochondria. Microsc. Res. Tech. 1994;27:198–219. - PubMed
    1. Cipolat S, de Brito OM, Dal Zilio B, Scorrano L. OPA1 requires mitofusin 1 to promote mitochondrial fusion. Proc. Natl. Acad. Sci. U. S. A. 2004;101:15927–15932. - PMC - PubMed
    1. Santel A, Fuller MT. Control of mitochondrial morphology by a human mitofusin. J. Cell Sci. 2001;114:867–874. - PubMed
    1. Smirnova E, Griparic L, Shurland DL, van der Bliek AM. Dynamin-related protein Drp1 is required for mitochondrial division in mammalian cells. Mol. Biol. Cell. 2001;12:2245–2256. - PMC - PubMed
    1. Cereghetti GM, et al. Dephosphorylation by calcineurin regulates translocation of Drp1 to mitochondria. Proc. Natl. Acad. Sci. U. S. A. 2008;105:15803–15808. - PMC - PubMed

Publication types

Substances