. 2011 Apr 15;145(2):183-97.
doi: 10.1016/j.cell.2011.03.003. Epub 2011 Apr 7.

Wdr5 mediates self-renewal and reprogramming via the embryonic stem cell core transcriptional network

Affiliations

Wdr5 mediates self-renewal and reprogramming via the embryonic stem cell core transcriptional network

Yen-Sin Ang et al. Cell. .

Abstract

The embryonic stem (ES) cell transcriptional and chromatin-modifying networks are critical for self-renewal maintenance. However, it remains unclear whether these networks functionally interact and, if so, what factors mediate such interactions. Here, we show that WD repeat domain 5 (Wdr5), a core member of the mammalian Trithorax (trxG) complex, positively correlates with the undifferentiated state and is a regulator of ES cell self-renewal. We demonstrate that Wdr5, an "effector" of H3K4 methylation, interacts with the pluripotency transcription factor Oct4. Genome-wide protein localization and transcriptome analyses demonstrate overlapping gene regulatory functions between Oct4 and Wdr5. The Oct4-Sox2-Nanog circuitry and trxG cooperate in activating transcription of key self-renewal regulators, and furthermore, Wdr5 expression is required for the efficient formation of induced pluripotent stem (iPS) cells. We propose an integrated model of transcriptional and epigenetic control, mediated by select trxG members, for the maintenance of ES cell self-renewal and somatic cell reprogramming.


Figures

Figure 1
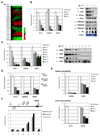
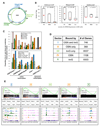
Figure 1. Down-regulation of Wdr5 expression upon ES cell differentiation
(A) Heatmap of trxG-associated member expressions during RA-induction from (Ivanova et al., 2006) (B, C) Real-time PCR (left) and immunoblot (right) analyses during RA-induction and EB-formation. (D) Real-time PCR analysis after 3 days shRNA knockdown of Nanog, Oct4. (E) Real-time PCR analysis in Nanog-inducible (Ivanova et al., 2006), Oct4-repressible lines (Schaniel et al., 2009). All data normalized to actin and shown relative to Day0 or GFP shRNA. (F) ChIP-qPCR analysis of Oct4, Nanog occupancy at Wdr5 locus. Numbered grey bars denote primer locations. Glutathione S-transferase (GST) ChIP as negative control. Values expressed as Fold Enrichment relative to input DNA and a control region (Loh et al., 2007). Data represented as mean ± s.d, n=3. See also Figure S1.
Figure 2
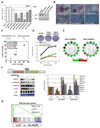
Figure 2. Wdr5 depletion resulted in loss of self-renewal and collapse of extended transcriptional network
(A) Real-time PCR (left) and immunoblot (right) analyses after 4 days Wdr5 knockdown (B) AP staining after 4 days shRNA knockdown. (C) ES cell competition assay (Ivanova et al., 2006) in E14 and CCE cells. Luciferase (LUC), Nanog and LIFR shRNAs serve as negative and positive controls respectively. (D) Secondary ES colony re-plating assay (Tay et al., 2008). Circles depict colonies from the 600 cell-replated wells. (E) Gene expression of composite transcriptional network (Chen et al., 2008; Kim et al., 2008) after 4 days Wdr5-depletion as measured by real-time PCR. Log2 fold change relative to GFP shRNA. (F) Scheme of tetracycline-inducible Wdr5-rescue construct (top). Immunoblot analysis after Dox withdrawal in Wdr5R #4 (left). Orange box shows H3K4me3-reduction preceding the loss of Oct4, Nanog. Real-time PCR analysis (right) after 5 days Wdr5 knockdown (−dox) or with rescue (+dox) in two clones (Wdr5R#4,#12). All data normalized to actin and shown relative to Vector, GFP shRNA or Luc rescue clone (LucR). Data represented as mean ± s.d, n=3. (G) GSEA of a geneset representing self-renewal markers upon Wdr5 knockdown. NES = normalized enrichment score; p= nominal p-value; FDR= false discovery rate. See also Figure S1 and S2.
Figure 3
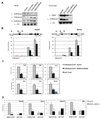
Figure 3. Wdr5 maintains global and localized H3K4 tri-methylation
(A) Immunoblot after 4 days Wdr5 knockdown. Whole cell extract (WCE). (B, C) ChIP-qPCR analysis of H3K4me3 mark at various loci after Wdr5 knockdown. Numbered grey bars denote primer locations. (D) ChIP-qPCR analysis of RNAP-II localization at various loci after Wdr5 knockdown. Values expressed as Fold Enrichment relative to input DNA and a control region. All data represented as mean ± s.d., n=3, *P <0.005. See also Figure S3
Figure 4
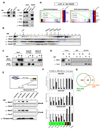
Figure 4. Oct4 interacts with Wdr5 and share overlapping gene regulatory functions
(A) Co-IP show Oct4 interaction with Wdr5. Oct4 pulldown of Wdr5 protein (left). Flag was used to IP for Wdr5 in Wdr5_FL2 line (right). IP was repeated 3 times. (B) Gel-filtration analysis of ES cell nuclear extracts. Migration of molecular markers is indicated above the panels and immunoblot antibodies shown on the left. (C) Epitope-tagged co-IP in 293T cells. Flag-Oct4 (O) pulled-down Myc-Wdr5 (W), and vice versa. Flag/myc antibodies used for both IP and WB. Input shows equal expression. (D) in vitro binding assay using recombinant Oct4 (O) and Wdr5 (W). Proteins were immunoblotted after IP with Oct4 antibody. (E) Sequential Peptide IP assay. Flag-mediated IP of Wdr5-Oct4 complex (IP1) then biotin-peptide-mediated IP (IP2) show Oct4 specificity for H3K4me3 peptide. IP2 performed in 200mM or 275mM salt. Lane-1 (Flag Elute) is protein extract before IP2. H3(1–20) represents first 20 amino acids on unmodified H3. Streptavidin blot shows equal peptides IP’ed. (F) ChIP-qPCR analysis of Oct4-, Wdr5-binding and H3K4me3 levels after 2 days Oct4-depletion. Values expressed as Fold Enrichment relative to ZHBTc4. Control denotes intergenic region bound neither by Wdr5 nor Oct4. Heatmap shows Log2 expression of genes upon Oct4-depletion. All data represented as mean ± s.d., n=3. (G) Venn diagram of differentially-expressed genes in Wdr5- and Oct4-depleted ES cells. P-value for overlap as computed using Monte Carlo simulation is <1e−08. (H) GSEA analyses of two gene-sets representing Oct4-activated (left) and Oct4-repressed (right) genes. Heatmap represents top enriched genes. (red= high expression; blue=low). Note similarity to Figure S5A. See also Figure S4 and S5.
Figure 5
Figure 5. Genome-wide mapping of Wdr5, Oct4, H3K4me3, and Rbbp5 localizations using ChIP-seq
(A) Percentage distribution of ChIP-seq binding regions relative to nearest Refseq genes for Wdr5, Rbbp5, H3K4me3 and Oct4. (B) Distributions of Rbbp5, Wdr5 and Oct4 sequence-tags relative to the transcription start site of 26412 RefSeq genes. Tag counts were normalized to total number of tags in each sequencing reaction. (C) Venn diagram showing overlap of Wdr5 (green) and Oct4 bound (orange) genes. (D) Heatmap of co-localization frequency of Wdr5, Rbbp5, H3K4me3 and Oct4 binding regions with published datasets (Bilodeau et al., 2009; Chen et al., 2008; Marson et al., 2008; Mikkelsen et al., 2007; Pasini et al., 2010; Rahl et al., 2010). Factors were hierarchically-clustered using average-linkage metric along both axes. (E) Boxplots show median (red bar), 25th and 75th percentile number of ChIP-seq tags. Blue bar show 2.5th and 97.5th percentile. See also Figure S6.
Figure 6
Figure 6. Oct4, Sox2, Nanog and trxG are partners in transcriptional activation
(A) Venn diagram showing overlap of Wdr5-, Rbbp5-, H3K4me3- ChIP target genes. (B) 18096 Refseq genes were divided equally into 3 expression-groups and plotted against each ChIP-seq tag signals. Boxplots show median (red bar), 25th and 75th percentile number of ChIP-seq tags. Whiskers show 2.5th and 97.5th percentile. (C) Proportion (%) of each geneset (colored bars), extracted from published (Chen et al., 2008; Marson et al., 2008) and current ChIP-seq datasets, containing markers of active and repressive transcription. Wdr5, Rbbp5, H3K4me3 co-bound (trxG). All Refseq (grey bar, black-dotted line) genes represents baseline %. (D) Chart showing number of trxG and OSN bound genes sub-classified into five sectors. [I]=OSN & trxG, [II]=OSN without trxG, [III]=trxG without OSN, [IV]=OSN_all, [V]=trxG_all. (E) Table containing GSEA (top-row) of mRNA expressions upon EB-differentiation (Perez-Iratxeta et al., 2005), representative gene names (middle-row) and ChIP-seq binding profiles (bottom-row) for genes in sectors [I]–[V]. See also Figure S6.
Figure 7
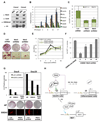
Figure 7. Increased Wdr5 expression is required for reprogramming of Oct4-GFP MEFs by defined factors
(A) Immunoblot of two independent iPS clones and their parental MEFs. (B) Real-time PCR of trxG-associated members during iPS induction. Data normalized to actin and shown relative to MEF. Data represented as mean ± s.d., n=3. (C) High and low GFP positive colonies were counted 14 days post-OSKM in Wdr5- and Luc-knockdown cells. Data represented as mean ± s.d. (D) AP staining of entire wells (circles) and representative colonies (squares) from Wdr5- and Luc- knockdown iPS colonies at Day 14. (E) MTT proliferation assay of MEF transduced with Luc or Wdr5 shRNA. (F) Wdr5-depletion during iPS reprogramming. GFP+++ colonies counted at Day 14. OSKM only did not receive Wdr5-shRNA. (G) AP, SSEA1 and GFP intensity assessed at early (Day 8) or late stages (Day 20) of iPS induction with (green bar) or without (black bar) Wdr5-shRNA. AP staining of entire wells (circles) and representative SSEA1 colonies (squares) depicted. (H) Proposed model. See also Figure S7.

Similar articles

Cited by

References

    1. Bernstein BE, Mikkelsen TS, Xie X, Kamal M, Huebert DJ, Cuff J, Fry B, Meissner A, Wernig M, Plath K, et al. A bivalent chromatin structure marks key developmental genes in embryonic stem cells. Cell. 2006;125:315–326. - PubMed
    1. Bilodeau S, Kagey MH, Frampton GM, Rahl PB, Young RA. SetDB1 contributes to repression of genes encoding developmental regulators and maintenance of ES cell state. Genes Dev. 2009;23:2484–2489. - PMC - PubMed
    1. Boyer LA, Plath K, Zeitlinger J, Brambrink T, Medeiros LA, Lee TI, Levine SS, Wernig M, Tajonar A, Ray MK, et al. Polycomb complexes repress developmental regulators in murine embryonic stem cells. Nature. 2006;441:349–353. - PubMed
    1. Cao F, Chen Y, Cierpicki T, Liu Y, Basrur V, Lei M, Dou Y. An Ash2L/RbBP5 Heterodimer Stimulates the MLL1 Methyltransferase Activity through Coordinated Substrate Interactions with the MLL1 SET Domain. PLoS One. 2010;5:e14102. - PMC - PubMed
    1. Carvajal-Vergara X, Sevilla A, D’Souza SL, Ang YS, Schaniel C, Lee DF, Yang L, Kaplan AD, Adler ED, Rozov R, et al. Patient-specific induced pluripotent stem-cell-derived models of LEOPARD syndrome. Nature. 2010;465:808–812. - PMC - PubMed

Publication types

MeSH terms

Associated data