The transcription elongation factor Spt5 influences transcription by RNA polymerase I positively and negatively
- PMID: 21467039
- PMCID: PMC3099698
- DOI: 10.1074/jbc.M110.202101
The transcription elongation factor Spt5 influences transcription by RNA polymerase I positively and negatively
Abstract
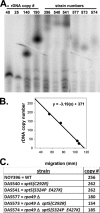
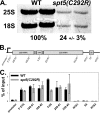
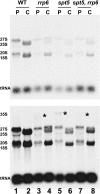
Spt5p is a universally conserved transcription factor that plays multiple roles in eukaryotic transcription elongation. Spt5p forms a heterodimer with Spt4p and collaborates with other transcription factors to pause or promote RNA polymerase II transcription elongation. We have shown previously that Spt4p and Spt5p also influence synthesis of ribosomal RNA by RNA polymerase (Pol) I; however, previous studies only characterized defects in Pol I transcription induced by deletion of SPT4. Here we describe two new, partially active mutations in SPT5 and use these mutant strains to characterize the effect of Spt5p on Pol I transcription. Genetic interactions between spt5 and rpa49Δ mutations together with measurements of ribosomal RNA synthesis rates, rDNA copy number, and Pol I occupancy of the rDNA demonstrate that Spt5p plays both positive and negative roles in transcription by Pol I. Electron microscopic analysis of mutant and WT strains confirms these observations and supports the model that Spt4/5 may contribute to pausing of RNA polymerase I early during transcription elongation but promotes transcription elongation downstream of the pause(s). These findings bolster the model that Spt5p and related homologues serve diverse critical roles in the control of transcription.
Figures


Similar articles
-
Yeast transcription elongation factor Spt5 associates with RNA polymerase I and RNA polymerase II directly.J Biol Chem. 2011 May 27;286(21):18825-33. doi: 10.1074/jbc.M110.202119. Epub 2011 Apr 5. J Biol Chem. 2011. PMID: 21467036 Free PMC article.
-
RNA polymerase II elongation factors Spt4p and Spt5p play roles in transcription elongation by RNA polymerase I and rRNA processing.Proc Natl Acad Sci U S A. 2006 Aug 22;103(34):12707-12. doi: 10.1073/pnas.0605686103. Epub 2006 Aug 14. Proc Natl Acad Sci U S A. 2006. PMID: 16908835 Free PMC article.
-
Biochemical Analysis of Yeast Suppressor of Ty 4/5 (Spt4/5) Reveals the Importance of Nucleic Acid Interactions in the Prevention of RNA Polymerase II Arrest.J Biol Chem. 2016 May 6;291(19):9853-70. doi: 10.1074/jbc.M116.716001. Epub 2016 Mar 4. J Biol Chem. 2016. PMID: 26945063 Free PMC article.
-
The pleiotropic roles of SPT5 in transcription.Transcription. 2022 Feb-Jun;13(1-3):53-69. doi: 10.1080/21541264.2022.2103366. Epub 2022 Jul 25. Transcription. 2022. PMID: 35876486 Free PMC article. Review.
-
The Spt4-Spt5 complex: a multi-faceted regulator of transcription elongation.Biochim Biophys Acta. 2013 Jan;1829(1):105-15. doi: 10.1016/j.bbagrm.2012.08.007. Epub 2012 Sep 6. Biochim Biophys Acta. 2013. PMID: 22982195 Free PMC article. Review.
Cited by
-
Spt4 Promotes Pol I Processivity and Transcription Elongation.Genes (Basel). 2021 Mar 12;12(3):413. doi: 10.3390/genes12030413. Genes (Basel). 2021. PMID: 33809333 Free PMC article.
-
Diverse Regulators of Human Ribosome Biogenesis Discovered by Changes in Nucleolar Number.Cell Rep. 2018 Feb 13;22(7):1923-1934. doi: 10.1016/j.celrep.2018.01.056. Cell Rep. 2018. PMID: 29444442 Free PMC article.
-
Regulation of Eukaryotic RNAPs Activities by Phosphorylation.Front Mol Biosci. 2021 Jun 25;8:681865. doi: 10.3389/fmolb.2021.681865. eCollection 2021. Front Mol Biosci. 2021. PMID: 34250017 Free PMC article. Review.
-
KAP1 negatively regulates RNA polymerase II elongation kinetics to activate signal-induced transcription.bioRxiv [Preprint]. 2024 May 5:2024.05.05.592422. doi: 10.1101/2024.05.05.592422. bioRxiv. 2024. Update in: Nat Commun. 2024 Jul 12;15(1):5859. doi: 10.1038/s41467-024-49905-7. PMID: 38746145 Free PMC article. Updated. Preprint.
-
RNA polymerase I activity is regulated at multiple steps in the transcription cycle: recent insights into factors that influence transcription elongation.Gene. 2012 Feb 10;493(2):176-84. doi: 10.1016/j.gene.2011.08.006. Epub 2011 Aug 26. Gene. 2012. PMID: 21893173 Free PMC article. Review.
References
-
- Warner J. R. (1999) Trends Biochem. Sci. 24, 437–440 - PubMed
-
- Nomura M., Nogi Y., Oakes M. (2004) in The Nucleolus (Olson M. O. J. ed) Kluwer Academic/Plenum Publishers, London
Publication types
MeSH terms
Substances
Grants and funding
LinkOut - more resources
Full Text Sources
Molecular Biology Databases

