. 2011 Jun;300(6):L898-909.
doi: 10.1152/ajplung.00409.2010. Epub 2011 Apr 1.

Partial pneumonectomy of telomerase null mice carrying shortened telomeres initiates cell growth arrest resulting in a limited compensatory growth response

Affiliations

Partial pneumonectomy of telomerase null mice carrying shortened telomeres initiates cell growth arrest resulting in a limited compensatory growth response

Sha-Ron Jackson et al. Am J Physiol Lung Cell Mol Physiol. 2011 Jun.

Abstract

Telomerase mutations and significantly shortened chromosomal telomeres have recently been implicated in human lung pathologies. Natural telomere shortening is an inevitable consequence of aging, which is also a risk factor for development of lung disease. However, the impact of shortened telomeres and telomerase dysfunction on the ability of lung cells to respond to significant challenge is still largely unknown. We have previously shown that lungs of late generation, telomerase null B6.Cg-Terc(tm1Rdp) mice feature alveolar simplification and chronic stress signaling at baseline, a phenocopy of aged lung. To determine the role telomerase plays when the lung is challenged, B6.Cg-Terc(tm1Rdp) mice carrying shortened telomeres and wild-type controls were subjected to partial pneumonectomy. We found that telomerase activity was strongly induced in alveolar epithelial type 2 cells (AEC2) of the remaining lung immediately following surgery. Eighty-six percent of wild-type animals survived the procedure and exhibited a burst of early compensatory growth marked by upregulation of proliferation, stress response, and DNA repair pathways in AEC2. In B6.Cg-Terc(tm1Rdp) mice carrying shortened telomeres, response to pneumonectomy was characterized by decreased survival, diminished compensatory lung growth, attenuated distal lung progenitor cell response, persistent DNA damage, and cell growth arrest. Overall, survival correlated strongly with telomere length. We conclude that functional telomerase and properly maintained telomeres play key roles in both long-term survival and the early phase of compensatory lung growth following partial pneumonectomy.


Figures

Fig. 1.
Fig. 1.
Telomerase activity in wild-type (WT) alveolar epithelial type 2 cells (AEC2) at 3 and 7 days following partial pneumonectomy (PNX) or sham thoracotomy (THX). WT mice were subjected to PNX or THX as described. Right lungs were harvested on days 3 and 7 of recovery and AEC2 were isolated. Telomerase activity was assayed in fresh isolates. For both PNX postoperative day (POD)3 and POD7 time points, telomerase activity in isolated AEC2 was significantly higher than the level present in AEC2 isolated from sham-operated lung (*P = 0.0046 and **P = 0.0229 by Student's t-test; n = 3 for all groups).
Fig. 2.
Fig. 2.
Lung weight-to-body weight ratios (lung weight/body weight) at 3 and 7 days post-PNX or THX. The ratio of right lung weight to whole body weight (lung weight/body weight) was calculated for pneumonectomized or sham-operated mice at POD3 (THX and PNX groups) or POD7 (PNX only), and the resulting values were each multiplied by 100. By Student's t-test, the difference in lung weight/body weight for WT mice at PNX POD7 was significant compared with the ratio for THX samples (*P = 0.0019) and also significant compared with the ratio for terc−/− 3rd generation (F3) PNX at the same time point (**P = 0.0026). No significant difference was noted when ratios for terc−/−F3 THX and PNX POD7 were compared (P = 0.2746; n = 3–8 for all groups).
Fig. 3.
Fig. 3.
WT and terc−/− AEC2 and bronchoalveolar epithelial stem cells (BASC) in situ at baseline. Sections from nonoperated mouse lung were fixed and subjected to immunohistochemistry using rabbit and goat primary antibodies, a Cy3-labeled anti-rabbit IgG secondary antibody, and a FITC-labeled anti-goat IgG secondary antibody. Nuclei were stained with 4,6-diamidino-2-phenylindole (DAPI). To control for nonspecific antibody staining, purified rabbit or goat IgG, at the same concentrations as specific primary antibodies, were used to probe adjacent sections (not shown). A: representative sections used for AEC2 and BASC quantitation in situ. Expression of AEC2 marker surfactant protein-C (SP-C; red) was analyzed for each sample. Total cells per field were detected by nuclear DAPI staining (blue). Top and bottom left: AEC2 distribution in WT, terc−/−F2, and terc−/−F3 lung. Bottom right: a representative WT section probed by using an additional antibody for Clara cell marker CC10 (green) visualized with FITC-labeled secondary antibody. Overlay of images of SP-C and CC10 expression patterns reveals the presence of SP-C/CC10 double-positive BASC (yellow). Section presented shows a bronchoalveolar duct junction located in a transitional airway of distal lung tissue. B: baseline percentage of AEC2 per total cells per field. SP-C-labeled sections from nonoperated WT, terc−/−F2, and terc−/−F3 lungs were observed microscopically and the number of total cells as represented by DAPI staining, as well as the number of SP-C-positive cells, were counted within the same microscopic field at ×20. For each sample, n = 6–12 (fields chosen from slides containing sections from 2–3 animals with 3–6 sections/slide). The difference in AEC2 percentage for terc−/−F2 was not significant compared with WT (P = 0.1471). The difference between WT and terc−/−F3 AEC2 percentage was significant (*P = 0.0482). C: baseline distribution of BASC per transitional airway (TA). SP-C/CC10 double-labeled sections from nonoperated WT, terc−/−F2, and terc−/−F3 lungs were observed microscopically and the number of BASC contained in every transitional airway in each section were recorded. For each sample, n = 4–8, representing complete sections from 2 animals analyzed per group. Values were grouped so that each cohort could be compared for BASC density per TA and the mean percentage of TAs per section containing 0, 1, or 2+ BASC (0, 1, or 2+, respectively) was calculated. No significant difference was noted in the percentage of TA/section that contained 0 or 1 BASC when WT, terc−/−F2, and terc−/−F3 samples were compared. Both terc−/−F2 and terc−/−F3 sections exhibited a lower percentage of TAs that contained 2 or more BASC compared with WT (*P = 0.0064 for terc−/−F2 vs. WT and **P = 0.0106 for terc−/−F3 vs. WT). D: baseline percentage TA/section that contain BASC. To consolidate distribution data, values from the analyses shown in C were grouped to determine the mean percentage of TAs per section that contained 1 or more BASC. The mean percentage of TAs per section containing BASC in terc−/−F2 samples was not significantly different from the percentage found in WT lung. The percentage of BASC-containing TAs per section in terc−/−F3 lung was significantly lower than that of WT (*P = 0.0351). C, control.
Fig. 4.
Fig. 4.
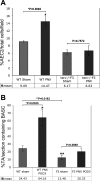
AEC2 and BASC in situ post-PNX. A: AEC2 per total cells per field at THX and PNX POD3. SP-C-labeled sections from postsurgery POD3 PNX and THX WT and terc−/−F3 lungs were observed microscopically and the number of total cells as represented by DAPI staining as well as the number of SP-C-positive cells were counted within the same microscopic field at ×20. For each sample, n = 6–10 (fields chosen from slides containing sections from 2 animals with 3–5 sections/slide). The mean percentage of AEC2/total cells in PNX POD3 WT lung was significantly higher than the percentage in THX WT controls (*P = 0.0082). The difference in AEC2 percentage in PNX vs. THX terc−/−F3 lung was not significant (P = 0.7572). B: percentage TA/section containing BASC at THX and PNX POD3. The mean percentage of TAs per section that contained 1 or more BASC was calculated for postsurgery POD3 PNX and THX WT and terc−/−F3 samples. For each sample, n = 8–12 (complete sections from 2 animals with 4–6 sections/slide). The difference in the mean percentage of TAs containing BASC per section in PNX vs. THX POD3 WT lung was highly significant (*P = 0.0035). The percentage of TAs containing BASC in POD3 sham-operated WT lung was significantly greater than the percentage in terc−/−F3 THX POD3 lung (**P = 0.0182). The percentages of TAs per section containing BASC when PNX vs. THX POD3 terc−/−F3 sections were compared and the difference by Student's t-test was not significant (P = 0.0989).
Fig. 5.
Fig. 5.
Proliferation marker expression in whole lung and AEC2 WT and terc−/−F3 post-PNX. A: Ki-67 expression in whole lung. Representative sections from sham-operated samples at POD3 and postpneumonectomy samples harvested at POD1, POD2, and POD3 (D1, D2, and D3, respectively) were fixed and subjected to immunohistochemistry using Ki-67 primary antibody and Cy-3 secondary antibody (red). Nuclei were stained with DAPI. Nonoperated control samples were also prepared and analyzed for Ki-67 expression (not shown). Negative controls for Ki-67 antibody binding were performed on adjacent sections using mouse IgG in place of specific primary antibody (not shown). B: percentage of Ki-67-positive cells per total cells per field in WT and terc−/−F3 lung post-PNX. For each group, n = 6 (fields chosen from slides containing sections from 2 animals with 3 sections/slide). Ki-67-positive cells per total number of cells per microscopic field were quantitated by calculating the percentage of marker positive (red) nuclei per total nuclei as stained by DAPI in each ×20 field analyzed. The percentage of Ki-67-positive cells in WT POD2 lung was significantly higher than the percentages in WT nonoperated control (**P = 0.0045) and WT THX POD3 control (***P = 0.0084). WT POD1 and POD3 samples exhibited significantly more Ki-67-positive cells than nonoperated control (*P = 0.0217 for PNX POD1), but not sham-operated control (P = 0.1205 for PNX POD1). Both WT and terc−/−F3 THX control samples showed elevated Ki-67 expression compared with nonoperated controls and in both cohorts and these differences were significant by Student's t-test (·P = 0.0217; ··P = 0.0221). No significant change in the percentage of Ki-67-positive cells was observed in post-PNX terc−/−F3 lung samples compared with terc−/−F3 nonoperated control at any post-PNX time point. All post-PNX terc−/−F3 samples exhibited significantly fewer Ki-67-positive cells than sham-operated control samples. C: expression of proliferative markers early growth response protein-1 (Egr-1), MAP kinase ERK1/2, and PCNA in AEC2 harvested post-PNX from WT and terc−/−F3 mice. AEC2 were isolated from right lungs harvested from sham-operated mice at POD3 (S) and from pneumonectomized mice at POD1, POD2, and POD3. Cell lysates were probed for expression of Egr-1, PCNA, and MAP kinase ERK1/2, with expression of actin used as a loading control. Blot shown is representative of multiple blots (3–5) using samples from 3–4 different animals/time point.
Fig. 6.
Fig. 6.
DNA damage/repair and cell cycle marker expression in AEC2 and whole lung post-PNX. A: representative sections used for 8-oxoguanine (8-OHdG) quantitation in situ. Representative sections from nonoperated and post-PNX POD3 lungs were fixed and subjected to immunohistochemistry using 8-OHdG primary antibody and FITC-labeled secondary antibody (green). Nuclei were stained with DAPI (blue). Negative controls for 8-OHdG antibody binding were performed on adjacent sections using rabbit IgG in place of specific primary antibody (not shown). B: percentage of 8-OHdG-positive cells per total cells per field post-PNX. Multiple tissue samples from nonoperated WT or terc−/−F3 right lung or corresponding samples from tissue remaining post-PNX at POD3 were fixed and probed for the presence of 8-OHdG adducts. For each group, n = 6 (fields chosen from slides containing sections from 2 animals with 3 sections/slide). At baseline, the percentage of 8-OHdG-positive cells in terc−/−F3 nonoperated lung was significantly higher than the level observed in WT nonoperated lung (*P = 0.0236). Conversely, the percentage of 8-OHdG-positive cells was not significantly greater post-PNX in terc−/−F3 POD3 lung than in WT at the same time point (P = 0.1209). The percentage of 8-OHdG-positive cells in WT PNX POD3 lung was higher than the percentage in nonoperated control (**P = 0.0224), but the percentage of 8-OHdG-positive cells in terc−/−F3 PNX POD3 lung was not significant compared with percentages in nonoperated terc−/−F3 lung (P = 0.7615). C: expression of stress activated MAP-kinase phospho-SAPK/phospho-JNK and apoptotic marker C-PARP. AEC2 and whole lung tissue were isolated from right lungs harvested from sham-operated mice at POD3 and from pneumonectomized mice at POD1, POD2, and POD3. Cell lysates were probed for expression of chaperone HSP27, MAP kinase P-SAPK/P-JNK and apoptotic marker cleaved PARP. Whole lung tissue lysates from sham-operated (S) and PNX POD3 (D3) mice were probed for expression of apoptotic marker PARP in both its cleaved (bottom band) and uncleaved (top band) forms. Expression of actin was used as a loading control. Blot shown is representative of multiple blots (3–5) using samples from 3–4 different animals/time point. D: expression of DNA damage markers and repair enzymes. AEC2 were isolated from right lungs harvested from sham-operated mice at POD3 and from pneumonectomized mice at POD1, POD2, and POD3. Cell lysates were probed for expression of DNA repair enzymes Ogg-1 and Gadd153, chaperone HSP27, and cell cycle control protein p21. Expression of actin was used as a loading control. Blot shown is representative of multiple blots (2–3) using samples from 2–3 different animals/time point.

Similar articles

Cited by

References

    1. Adamson YR, Bowden DH. The Type 2 cell as progenitor of alveolar epithelial regeneration. A cytodynamic study in mice after exposure to oxygen. Lab Invest 30: 35–42, 1974 - PubMed
    1. Alder JK, Chen JJ, Lancaster L, Danoff S, Su SC, Cogan JD, Vulto I, Xie M, Qi X, Tuder RM, Phillips JA, 3rd, Lansdorp PM, Loyd JE, Armanios MY. Short telomeres are a risk factor for idiopathic pulmonary fibrosis. Proc Natl Acad Sci USA 105: 13051–13056, 2008 - PMC - PubMed
    1. Armanios M, Chen JL, Chang YPC, Brodsky RA, Hawkins A, Griffin CA, Eshleman JR, Cohen AR, Chakravarti A, Hamosh A, Greider CW. Haploinsufficiency of telomerase reverse transcriptase leads to anticipation in autosomal dominant dyskeratosis congenita. Proc Natl Acad Sci USA 102: 15960–15964, 2005 - PMC - PubMed
    1. Armanios MY, Chen JJ, Cogan JD, Alder JK, Ingersoll RG, Markin C, Lawson WE, Xie M, Vulto I, Phillips JA, 3rd, Lansdorp PM, Greider CW, Loyd JE. Telomerase mutations in families with idiopathic pulmonary fibrosis. N Engl J Med 356: 1317–1326, 2007 - PubMed
    1. Armanios M, Alder JK, Parry EM, Karim B, Strong MA, Greider CW. Short telomeres are sufficient to cause the degenerative defects associated with aging. Am J Hum Genet 85: 823–832, 2009 - PMC - PubMed

Publication types

LinkOut - more resources