Distinct representations of olfactory information in different cortical centres
- PMID: 21451525
- PMCID: PMC3354569
- DOI: 10.1038/nature09868
Distinct representations of olfactory information in different cortical centres
Abstract
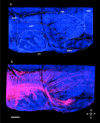
Sensory information is transmitted to the brain where it must be processed to translate stimulus features into appropriate behavioural output. In the olfactory system, distributed neural activity in the nose is converted into a segregated map in the olfactory bulb. Here we investigate how this ordered representation is transformed in higher olfactory centres in mice. We have developed a tracing strategy to define the neural circuits that convey information from individual glomeruli in the olfactory bulb to the piriform cortex and the cortical amygdala. The spatial order in the bulb is discarded in the piriform cortex; axons from individual glomeruli project diffusely to the piriform without apparent spatial preference. In the cortical amygdala, we observe broad patches of projections that are spatially stereotyped for individual glomeruli. These projections to the amygdala are overlapping and afford the opportunity for spatially localized integration of information from multiple glomeruli. The identification of a distributive pattern of projections to the piriform and stereotyped projections to the amygdala provides an anatomical context for the generation of learned and innate behaviours.
Figures


Similar articles
-
Cortical representations of olfactory input by trans-synaptic tracing.Nature. 2011 Apr 14;472(7342):191-6. doi: 10.1038/nature09714. Epub 2010 Dec 22. Nature. 2011. PMID: 21179085 Free PMC article.
-
Sensory maps in the olfactory cortex defined by long-range viral tracing of single neurons.Nature. 2011 Apr 14;472(7342):217-20. doi: 10.1038/nature09945. Epub 2011 Mar 30. Nature. 2011. PMID: 21451523
-
Olfactory neuroscience: beyond the bulb.Curr Biol. 2011 Jun 7;21(11):R438-40. doi: 10.1016/j.cub.2011.04.036. Curr Biol. 2011. PMID: 21640905
-
Olfactory maps, circuits and computations.Curr Opin Neurobiol. 2014 Feb;24(1):120-32. doi: 10.1016/j.conb.2013.09.010. Epub 2013 Oct 29. Curr Opin Neurobiol. 2014. PMID: 24492088 Free PMC article. Review.
-
Olfactory perception as a compass for olfactory neural maps.Trends Cogn Sci. 2011 Nov;15(11):537-45. doi: 10.1016/j.tics.2011.09.007. Epub 2011 Oct 14. Trends Cogn Sci. 2011. PMID: 22001868 Review.
Cited by
-
Olfactory modulation of the medial prefrontal cortex circuitry: Implications for social cognition.Semin Cell Dev Biol. 2022 Sep;129:31-39. doi: 10.1016/j.semcdb.2021.03.022. Epub 2021 May 9. Semin Cell Dev Biol. 2022. PMID: 33975755 Free PMC article. Review.
-
Representational drift in primary olfactory cortex.Nature. 2021 Jun;594(7864):541-546. doi: 10.1038/s41586-021-03628-7. Epub 2021 Jun 9. Nature. 2021. PMID: 34108681
-
Distinct protocerebral neuropils associated with attractive and aversive female-produced odorants in the male moth brain.Elife. 2021 May 14;10:e65683. doi: 10.7554/eLife.65683. Elife. 2021. PMID: 33988500 Free PMC article.
-
Comprehensive connectivity of the mouse main olfactory bulb: analysis and online digital atlas.Front Neuroanat. 2012 Aug 7;6:30. doi: 10.3389/fnana.2012.00030. eCollection 2012. Front Neuroanat. 2012. PMID: 22891053 Free PMC article.
-
SeeDB: a simple and morphology-preserving optical clearing agent for neuronal circuit reconstruction.Nat Neurosci. 2013 Aug;16(8):1154-61. doi: 10.1038/nn.3447. Epub 2013 Jun 23. Nat Neurosci. 2013. PMID: 23792946
References
-
- Buck L, Axel R. A novel multigene family may encode odorant receptors: a molecular basis for odor recognition. Cell. 1991;65:175–187. - PubMed
-
- Malnic B, Hirono J, Sato T, Buck LB. Combinatorial receptor codes for odors. Cell. 1999;96:713–723. - PubMed
-
- Chess A, Simon I, Cedar H, Axel R. Allelic inactivation regulates olfactory receptor gene expression. Cell. 1994;78:823–834. - PubMed
-
- Niimura Y, Nei M. Evolutionary changes of the number of olfactory receptor genes in the human and mouse lineages. Gene. 2005;346:23–28. - PubMed
-
- Ressler KJ, Sullivan SL, Buck LB. Information coding in the olfactory system: evidence for a stereotyped and highly organized epitope map in the olfactory bulb. Cell. 1994;79:1245–1255. - PubMed
Publication types
MeSH terms
Grants and funding
LinkOut - more resources
Full Text Sources
Other Literature Sources

