MicroRNA programs in normal and aberrant stem and progenitor cells
- PMID: 21451113
- PMCID: PMC3083097
- DOI: 10.1101/gr.111385.110
MicroRNA programs in normal and aberrant stem and progenitor cells
Abstract
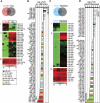
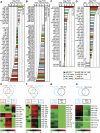
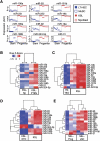
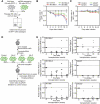
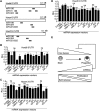
Emerging evidence suggests that microRNAs (miRNAs), an abundant class of ∼22-nucleotide small regulatory RNAs, play key roles in controlling the post-transcriptional genetic programs in stem and progenitor cells. Here we systematically examined miRNA expression profiles in various adult tissue-specific stem cells and their differentiated counterparts. These analyses revealed miRNA programs that are common or unique to blood, muscle, and neural stem cell populations and miRNA signatures that mark the transitions from self-renewing and quiescent stem cells to proliferative and differentiating progenitor cells. Moreover, we identified a stem/progenitor transition miRNA (SPT-miRNA) signature that predicts the effects of genetic perturbations, such as loss of PTEN and the Rb family, AML1-ETO9a expression, and MLL-AF10 transformation, on self-renewal and proliferation potentials of mutant stem/progenitor cells. We showed that some of the SPT-miRNAs control the self-renewal of embryonic stem cells and the reconstitution potential of hematopoietic stem cells (HSCs). Finally, we demonstrated that SPT-miRNAs coordinately regulate genes that are known to play roles in controlling HSC self-renewal, such as Hoxb6 and Hoxa4. Together, these analyses reveal the miRNA programs that may control key processes in normal and aberrant stem and progenitor cells, setting the foundations for dissecting post-transcriptional regulatory networks in stem cells.
Figures



Similar articles
-
The expression and functional roles of microRNAs in stem cell differentiation.BMB Rep. 2016 Jan;49(1):3-10. doi: 10.5483/BMBRep.2016.49.1.217. BMB Rep. 2016. PMID: 26497582 Free PMC article. Review.
-
Small RNAs, big potential: the role of MicroRNAs in stem cell function.Curr Stem Cell Res Ther. 2007 Dec;2(4):264-71. doi: 10.2174/157488807782793781. Curr Stem Cell Res Ther. 2007. PMID: 18220910 Review.
-
The microRNA regulation of stem cells.Wiley Interdiscip Rev Dev Biol. 2012 Jan-Feb;1(1):83-95. doi: 10.1002/wdev.5. Epub 2011 Nov 17. Wiley Interdiscip Rev Dev Biol. 2012. PMID: 23801669 Review.
-
Embryonic stem cell microRNAs: defining factors in induced pluripotent (iPS) and cancer (CSC) stem cells?Curr Stem Cell Res Ther. 2009 Sep;4(3):168-77. doi: 10.2174/157488809789057400. Curr Stem Cell Res Ther. 2009. PMID: 19492978 Review.
-
[Research advance of microRNA and stem cell].Zhongguo Xiu Fu Chong Jian Wai Ke Za Zhi. 2007 Sep;21(9):1007-10. Zhongguo Xiu Fu Chong Jian Wai Ke Za Zhi. 2007. PMID: 17933242 Review. Chinese.
Cited by
-
Expression, Regulation and Function of microRNA as Important Players in the Transition of MDS to Secondary AML and Their Cross Talk to RNA-Binding Proteins.Int J Mol Sci. 2020 Sep 27;21(19):7140. doi: 10.3390/ijms21197140. Int J Mol Sci. 2020. PMID: 32992663 Free PMC article. Review.
-
CXCR4 downregulation of let-7a drives chemoresistance in acute myeloid leukemia.J Clin Invest. 2013 Jun;123(6):2395-407. doi: 10.1172/JCI66553. Epub 2013 May 8. J Clin Invest. 2013. PMID: 23676502 Free PMC article.
-
Identification of featured biomarkers in different types of lung cancer with DNA microarray.Mol Biol Rep. 2014 Oct;41(10):6357-63. doi: 10.1007/s11033-014-3515-9. Epub 2014 Jul 8. Mol Biol Rep. 2014. Retraction in: Mol Biol Rep. 2015 Oct;42(10):1481. doi: 10.1007/s11033-015-3904-8. PMID: 25001589 Retracted.
-
MicroRNA 181b regulates decorin production by dermal fibroblasts and may be a potential therapy for hypertrophic scar.PLoS One. 2015 Apr 2;10(4):e0123054. doi: 10.1371/journal.pone.0123054. eCollection 2015. PLoS One. 2015. PMID: 25837671 Free PMC article.
-
The microRNA cluster miR-106b~25 regulates adult neural stem/progenitor cell proliferation and neuronal differentiation.Aging (Albany NY). 2011 Feb;3(2):108-24. doi: 10.18632/aging.100285. Aging (Albany NY). 2011. PMID: 21386132 Free PMC article.
References
-
- Akashi K, He X, Chen J, Iwasaki H, Niu C, Steenhard B, Zhang J, Haug J, Li L 2003. Transcriptional accessibility for genes of multiple tissues and hematopoietic lineages is hierarchically controlled during early hematopoiesis. Blood 101: 383–389 - PubMed
-
- Argiropoulos B, Humphries RK 2007. Hox genes in hematopoiesis and leukemogenesis. Oncogene 26: 6766–6776 - PubMed
Publication types
MeSH terms
Substances
Associated data
- Actions
Grants and funding
- DP1 OD006435-02/OD/NIH HHS/United States
- U01 HL100397/HL/NHLBI NIH HHS/United States
- P01 AG036695/AG/NIA NIH HHS/United States
- R01 CA104509/CA/NCI NIH HHS/United States
- R01 HL081612-05/HL/NHLBI NIH HHS/United States
- R01 AG020961/AG/NIA NIH HHS/United States
- R01 AI073724-03/AI/NIAID NIH HHS/United States
- R01 AI073724/AI/NIAID NIH HHS/United States
- DP1 OD006435/OD/NIH HHS/United States
- DP1 OD006435-03/OD/NIH HHS/United States
- R01 HL081612/HL/NHLBI NIH HHS/United States
- R01 HL081612-04W1/HL/NHLBI NIH HHS/United States
- DP1 CA174421/CA/NCI NIH HHS/United States
LinkOut - more resources
Full Text Sources
Other Literature Sources
Medical
Molecular Biology Databases
Research Materials
