. 2011 May 15;186(10):5729-37.
doi: 10.4049/jimmunol.1100102. Epub 2011 Mar 30.

Bcl-2 allows effector and memory CD8+ T cells to tolerate higher expression of Bim

Affiliations

Bcl-2 allows effector and memory CD8+ T cells to tolerate higher expression of Bim

Sema Kurtulus et al. J Immunol. .

Abstract

As acute infections resolve, most effector CD8(+) T cells die, whereas some persist and become memory T cells. Recent work showed that subsets of effector CD8(+) T cells, identified by reciprocal expression of killer cell lectin-like receptor G1 (KLRG1) and CD127, have different lifespans. Similar to previous reports, we found that effector CD8(+) T cells reported to have a longer lifespan (i.e., KLRG1(low)CD127(high)) have increased levels of Bcl-2 compared with their shorter-lived KLRG1(high)CD127(low) counterparts. Surprisingly, we found that these effector KLRG1(low)CD127(high) CD8(+) T cells also had increased levels of Bim compared with KLRG1(high)CD127(low) cells. Similar effects were observed in memory cells, in which CD8(+) central memory T cells expressed higher levels of Bim and Bcl-2 than did CD8(+) effector memory T cells. Using both pharmacologic and genetic approaches, we found that survival of both subsets of effector and memory CD8(+) T cells required Bcl-2 to combat the proapoptotic activity of Bim. Interestingly, inhibition or absence of Bcl-2 led to significantly decreased expression of Bim in surviving effector and memory T cells. In addition, manipulation of Bcl-2 levels by IL-7 or IL-15 also affected expression of Bim in effector CD8(+) T cells. Finally, we found that Bim levels were significantly increased in effector CD8(+) T cells lacking Bax and Bak. Together, these data indicate that cells having the highest levels of Bim are selected against during contraction of the response and that Bcl-2 determines the level of Bim that effector and memory T cells can tolerate.


Figures
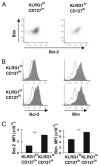
Figure 1
Figure 1
Levels of Bcl-2 and Bim are correlated in subpopulations of effector CD8+ T cells. C57BL/6 mice (n = 4 mice) were infected with 2 × 10⁵ PFU/mouse LCMVArm strain i.p. and sacrificed on either day 8 (A) or 10 (B) p.i. Cells from Bim−/− and Bim+/−Bcl-2−/− mice were included as Ab specificity controls in experiments in B. Single-cell spleen suspensions were stained with Dbgp33 tetramers and Abs against KLRG1, CD127, and CD8 and intracellularly against Bim and Bcl-2 and data acquired on a flow cytometer. A, Representative dot plots show Bim and Bcl-2 levels in subpopulations of CD8+ Dbgp33+ cells gated as KLRG1lowCD127high or KLRG1highCD127low cells. B, Representative histograms of Bim and Bcl-2 in KLRG1lowCD127high or KLRG1highCD127low cells from either C57BL/6 mice (filled histograms) or Bim−/− (open Bim histograms), Bim+/−Bcl-2−/− mice (open Bcl-2 histograms) are shown. C, Bar graphs show the mean fluorescence intensity (MFI) values ± SEM for Bim and Bcl-2 in KLRG1highCD127low or KLRG1lowCD127high cells from C57BL/6 mice on day 10 p.i. Data are pooled from two independent experiments including the one shown in B. p values for statistically significant differences were calculated by Student t test. **p ≥ 0.01.
Figure 2
Figure 2
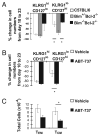
Bcl-2 is critical to combat Bim for survival of KLRG1low CD127high effector CD8+ T cells. A, Groups of C57BL/6, Bim+/−Bcl-2−/−, and Bim−/−Bcl-2−/− mice (n = 4 mice/group) were infected i.p. with 2 × 10⁵ PFU/mouse LCMV and sacrificed 10 or 23 d p.i. Splenocytes were stained with Dbgp33 tetramers and Abs against KLRG1, CD127, and CD8. CD8+GP33+ KLRG1lowCD127high or CD8+GP33+ KLRG1highCD127low populations were analyzed on days 10 or 23 after LCMV infection by flow cytometry. Bar graphs show the percentage decrease in the numbers of each CD8+ T cell effector subset ± SEM from day 10 to day 23 p.i. B, C57BL/6 mice were infected i.p. with LCMV. Mice were treated either with vehicle or the synthetic Bcl-2 inhibitor ABT-737 (1 mg/mouse/d) (n = 4 mice/group) between days 10 and 23 p.i. Mice were sacrificed 23 d p.i., and splenocytes were stained as in A. Bar graphs show the percentage decrease in the numbers of each CD8+ T cell effector subset ± SEM from days 10–23 p.i. Data are representative of two independent experiments. C, C57BL/6 mice were infected i.p. with LCMV. Mice (n = 9 mice/group) were treated either with vehicle or the synthetic Bcl-2 inhibitor ABT-737 between days 10 and 20 p.i as in B. Mice were sacrificed 110 d p.i., and splenocytes were stained with Dbgp33 tetramers and Abs against CD8, CD62L, and CD44. CD8+ TEM and TCM numbers ± SEM values are shown. Data are pooled from two independent experiments. *p ≤ 0.05.
Figure 3
Figure 3
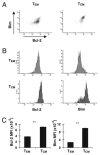
Expression of Bim and Bcl-2 in memory CD8+ T cell subpopulations. C57BL/6 mice were infected i.p. with LCMV. Mice (n = 6 mice/group) were sacrificed 100 d later, and splenocytes were stained with Dbgp33 tetramers and Abs against CD8, CD44, CD62L, and intracellularly against Bim or Bcl-2, and data were acquired on a flow cytometer and analyzed using FACSDiva software after gating on TEM (CD8+CD44high CD62Llow) (TEM) or TCM (CD8+CD44highCD62Lhigh) populations. A, Dot plots for Bim and Bcl-2 in TEM and TCM after gating on CD8+GP33+ cells. Histograms (B) and bar graphs (C) for Bim and Bcl-2 MFI in TEM or TCM CD8+ T cells are shown. Graphs are representative of three independent experiments. **p ≤ 0.01.
Figure 4
Figure 4
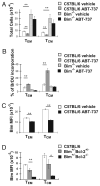
Bcl-2 is critical for survival of memory CD8+ T cells. Groups of C57BL/6 and Bim−/− mice (n = 5 mice/group) were infected i.p. with LCMV, and after 90 d, they were treated with either vehicle or ABT-737 (1 mg/mouse/d) for 10 d and sacrificed. Mice were also injected with BrdU (0.7 mg/mouse i.p.) for 2 d before sacrifice. Spleen cells were stained with Dbgp33 tetramers and Abs against CD8, CD44, and CD62L and analyzed by flow cytometry. A, Bar graphs indicate the total numbers ± SEM values of TEM (CD8+CD44highCD62Llow) or TCM (CD8+ CD44highCD62Lhigh) subsets. B, Splenocytes were stained with the above MHC tetramer and surface stains along with an Ab against BrdU according to the manufacturer's instructions. The percent of TEM and TCM that were BrdU+ ± SEM are shown. C, Splenocytes were also stained with the above MHC tetramer and surface stains along with an Ab against Bim. Bar graphs show Bim MFI ± SEM values in TEM and TCM subsets. Graphs are representative of three independent experiments. D, Groups of C57BL/6, Bim+/−Bcl-2−/−, and Bim+/−Bcl-2+/− mice (n = 4 mice/group) were infected i.p. with LCMV and sacrificed 100 d p.i. Splenocytes were stained with MHC tetramers and surface stains as above and intracellularly for Bim. Bar graphs show Bim MFI ± SEM values in TEM and TCM subsets. *p ≥ 0.05, **p ≤ 0.01.
Figure 5
Figure 5
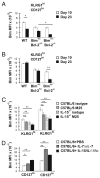
Bcl-2, IL-7, and IL-15 determine the level of Bim in effector CD8+ T cells. A and B, Groups of C57BL/6, Bim+/−Bcl-2−/−, and Bim−/− Bcl-2−/− mice (n = 4 mice/group) were infected i.p. with LCMV and sacrificed 10 or 23 d p.i. Splenocytes were stained with Dbgp33 tetramers and Abs against KLRG1, CD127, CD8, and intracellularly for Bim. Bar graphs show Bim MFI ± SEM values in KLRG1highCD127low (A) and KLRG1lowCD127high (B) subsets. Significant differences were observed for C57BL/6 mice between days 10 and 23 and between Bim+/−Bcl-2+/− and Bim+/−Bcl-2−/− mice on day 23 (A) and for Bim+/−Bcl-2−/− mice between days 10 and 23 (B). C, Groups of C57BL/6 or IL-15−/− mice (n = 5 mice/group) were infected with LCMV and treated i.p. with either isotype control (MPC11) or anti–IL-7 (M25) Ab (3 mg/mouse) on days 11, 13,15, 17, and 19 and sacrificed on day 20. Splenocytes were stained with Dbgp33 tetramers and Abs against KLRG1, CD8, and Bim. Bar graphs show Bim MFI ± SEM values in KLRG1high and KLRG1low subsets. D, C57BL/6 mice (n = 4 mice/group) were infected with LCMV, treated with PBS, IL-7/anti–IL-7 complexes, or IL-15/IL-15Rα complexes on days 8, 10, 12, and 14 p.i., and sacrificed on day 16 p.i. Splenocytes were stained with Dbgp33 tetramers and Abs against CD127, CD8, and Bim. Bar graphs show Bim MFI ± SEM values in CD127low and CD127high subsets. *p ≥ 0.05, **p ≤ 0.01.
Figure 6
Figure 6
Bcl-2 regulates the amount of Bim effector CD8+ T cells can tolerate. A, C57BL6 mice (n = 3 mice) were infected i.p. with LCMV. Mice were sacrificed 10 d p.i. together with uninfected C57BL/6 mice. Splenocytes were cultured with or without 2 μM CHX for 6 h and then stained with Db gp33 tetramers and Abs against CD8, KLRG1, CD127, and Bim. Bar graphs show the percentage change in Bim MFI levels ± SEM values in CHX-treated cells relative to uncultured cells. B, Groups of C57BL/6, Bim+/−, and Bim+/−Bcl-2−/− mice (n = 3 mice/group) were infected i.p. with LCMV and sacrificed 10 d p.i. Splenocytes were cultured with or without 2 μM CHX for 6 h and then stained as in A. Bar graphs show the percentage change in Bim MFI levels ± SEM values in CHX-treated cells relative to uncultured cells. CF, Groups of C57BL/6, Lck CreBaxf/f Bak−/− and Lck Cre+Baxf/fBak−/− mice (n = 3–6 mice/group) were infected i.p. with LCMV and sacrificed on days 20 and 23 p.i. Data in C, E, and F are pooled from two independent experiments. C, E, and F, Splenocytes were stained with Dbgp33 tetramers and Abs against KLRG1, CD127, and CD8 and intracellularly for Bim (C) and Bcl-2 (E). C, Bar graphs show Bim MFI ± SEM values in KLRG1highCD127low and KLRG1lowCD127high subsets. D, Real-time PCR for Bim mRNA from CD44+CD62LKLRG1highCD127low or CD44+CD62LKLRG1lowCD127high cells that were FACS sorted from pooled C57BL/6 mice or three Lck Cre+ Baxf/fBak−/− individual mice on day 23 p.i. Expression levels were normalized to L19 expression. Similar results were obtained in sorted cells on day 20 p.i. E, Bar graphs show Bcl-2 MFI ± SEM values in KLRG1highCD127low and KLRG1lowCD127high subsets. F, Bar graphs show the total numbers of each CD8+ T cell effector subset ± SEM. **p ≥ 0.01.

Similar articles

Cited by

References

    1. Gillette-Ferguson I, Sidman CL. A specific intercellular pathway of apoptotic cell death is defective in the mature peripheral T cells of autoimmune lpr and gld mice. Eur J Immunol. 1994;24:1181–1185. - PubMed
    1. Mogil RJ, Radvanyi L, Gonzalez-Quintial R, Miller R, Mills G, Theofilopoulos AN, Green DR. Fas (CD95) participates in peripheral T cell deletion and associated apoptosis in vivo. Int Immunol. 1995;7:1451–1458. - PubMed
    1. Singer GG, Abbas AK. The fas antigen is involved in peripheral but not thymic deletion of T lymphocytes in T cell receptor transgenic mice. Immunity. 1994;1:365–371. - PubMed
    1. Brunner T, Mogil RJ, LaFace D, Yoo NJ, Mahboubi A, Echeverri F, Martin SJ, Force WR, Lynch DH, Ware CF, et al. Cell-autonomous Fas (CD95)/Fas-ligand interaction mediates activation-induced apoptosis in T-cell hybridomas. Nature. 1995;373:441–444. - PubMed
    1. Dhein J, Walczak H, Bäumler C, Debatin KM, Krammer PH. Autocrine T-cell suicide mediated by APO-1/(Fas/CD95) Nature. 1995;373:438–441. - PubMed

Publication types

MeSH terms