. 2011 May 15;22(10):1716-26.
doi: 10.1091/mbc.E10-05-0404. Epub 2011 Mar 25.

Exophilin8 transiently clusters insulin granules at the actin-rich cell cortex prior to exocytosis

Affiliations

Exophilin8 transiently clusters insulin granules at the actin-rich cell cortex prior to exocytosis

Kouichi Mizuno et al. Mol Biol Cell. .

Abstract

Exophilin8/MyRIP/Slac2-c is an effector protein of the small GTPase Rab27a and is specifically localized on retinal melanosomes and secretory granules. We investigated the role of exophilin8 in insulin granule trafficking. Exogenous expression of exophilin8 in pancreatic β cells or their cell line, MIN6, polarized (exophilin8-positive) insulin granules at the cell corners, where both cortical actin and the microtubule plus-end-binding protein, EB1, were present. Mutation analyses indicated that the ability of exophilin8 to act as a linker between Rab27a and myosin Va is essential for its granule-clustering activity. Moreover, exophilin8 and exophilin8-associated insulin granules were markedly stable and immobile. Total internal reflection fluorescence microscopy indicated that exophilin8 restricts the motion of insulin granules at a region deeper than that where another Rab27a effector, granuphilin, accumulates docked granules directly attached to the plasma membrane. However, the exophilin8-induced immobility of insulin granules was eliminated upon secretagogue stimulation and did not inhibit evoked exocytosis. Furthermore, exophilin8 depletion prevents insulin granules from being transported close to the plasma membrane and inhibits their fusion. These findings indicate that exophilin8 transiently traps insulin granules into the cortical actin network close to the microtubule plus-ends and supplies them for release during the stimulation.


Figures
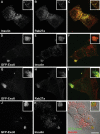
FIGURE 1:
FIGURE 1:
Localization of exophilin8 on insulin granules in MIN6 cells. MIN6 cells without (A–C) or with infection of adenovirus encoding EGFP-fused exophilin8 (GFP-Exo8; D–L) were double-imaged for insulin (A, E, and K), Rab27a (B and H), and GFP-Exo8 (D, G, and J) with a confocal laser scanning microscope. Panels C, F, and I show the merged images. The images in (J) and (K) are merged into the differential interference contrast microscopic image in (L). The detail is shown at a higher magnification (insets). Bar, 10 μm.
FIGURE 2:
FIGURE 2:
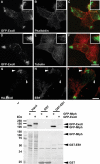
Relationship of exophilin8 with cytoskeletal components. (A–I) MIN6 cells were infected with adenovirus encoding either EGFP-fused exophilin8 (GFP-Exo8; A–F) or HA-tagged exophilin8 (HA-Exo8; G–I). They were double-imaged by confocal microscopy for GFP-Exo8 (A and D) and rhodamine-phalloidin (B) or α-tubulin (E), or by dual-color TIRF microscopy for HA-Exo8 (G) and EB1 (H). Note that the signal strengths of HA-Exo8 are correlated with those of EB1 (compare the cell corner indicated by an arrowhead with that by an arrow in G–I). Panels C, F, and I show the merged images. The detail was shown at a higher magnification (insets). Bars, 10 μm. (J) HEK293 cells were transfected with a plasmid encoding EGFP-fused melanophilin (GFP-Mlph) or GFP-Exo8. The cell lysates were incubated with GST alone or GST-fused EB1 (GST-EB1). The interacting proteins as well as aliquots of the original lysates (input) were analyzed by immunoblotting with anti–GFP antibody (top) followed by Coomassie brilliant blue R-250 staining (bottom).
FIGURE 3:
FIGURE 3:
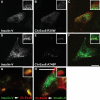
Effects of wild-type and mutant exophilin8 expression on insulin granule distribution. (A–F) MIN6 cells were coinfected by adenoviruses encoding preproinsulin-Venus (Insulin-V) and mCherry-fused exophilin8 (Ch-Exo8) R35W (A–C) or A748P (D–F) at moi 5, respectively. Two days after the infection, the cells were double-imaged for Insulin-V (A and D) and Ch-Exo8 (B and E) by confocal microscopy. Panels C and F show the merged images. (G and H) MIN6 cells were first infected with adenovirus encoding Insulin-V (G) or wild-type Ch-Exo8 (H). A day after the infection, the cells were then infected with adenovirus encoding Ch-Exo8 (G) and Insulin-V (H), respectively. The cells infected in tandem were double-imaged for Insulin-V and Ch-Exo8 by confocal microscopy. The detail is shown at a higher magnification (insets). Bars, 10 μm.
FIGURE 4:
FIGURE 4:
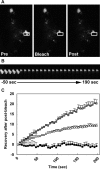
Dynamics of Rab27a and its effectors on insulin granules in MIN6 cells. (A) MIN6 cells were infected with adenovirus encoding EGFP-fused exophilin8 (GFP-Exo8). The region of interest (white squares) was bleached at time 0 with a high-intensity laser. (B) The kymograph showed the fluorescence recovery at 10-s intervals from −50 s to 190 s. (C) The fluorescence recovery of GFP-Exo8 (black squares) as well as that analyzed similarly for EGFP-fused granuphilin (GFP-Grph, gray squares) and Rab27a (GFP-Rab27a, white squares) were normalized and are shown as means ± SEM.
FIGURE 5:
FIGURE 5:
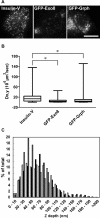
Motion and depth of exophilin8-positive insulin granules near the plasma membrane. (A) MIN6 cells were infected with adenovirus encoding preproinsulin-Venus (Insulin-V), EGFP-exophilin8 (GFP-Exo8), or EGFP-granuphilin (GFP-Grph). The cells were subjected to live cell imaging by a TIRF microscope with a penetration depth of 100 nm. Representative images are shown. Bar, 10 μm. (B) The TIRF images were taken every 82.9 ms over 200 time points. The GFP-positive structures were tracked, and the 2D diffusion coefficient Dx,y was calculated. Data are shown as box-plots: a box and a bar within the box indicate the 25–75% range and a median value, respectively, whereas outer bars represent minimum and maximum values. The statistical significance of differences was assessed by a Kruskal–Wallis test followed by Dunn's post test (*, P < 0.05). (C) The maximal fluorescence intensity corrected for background intensity was obtained from a TIRF image. Then the intensities of individual GFP-positive patches were converted to the z distance considering the exponential decay characteristic of the evanescent field. The relative z positions from the evanescent field origin of Insulin-V (white bars), GFP-Exo8 (black bars), and GFP-Grph (gray bars) were categorized into bins of 10 nm in width and expressed as the fraction of the total patches analyzed.
FIGURE 6:
FIGURE 6:
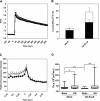
Insulin release from MIN6 cells expressing exophilin8. (A) MIN6 cells without (open squares, n = 70 cells from 5 fields) or with infection of adenovirus encoding HA-tagged exophilin8 (HA-Exo8; closed squares, n = 58 from 4 fields) were loaded with a Ca2+ indicator, Fluo-4, and stimulated by 60 mM KCl. The Fluo-4 fluorescence was defined as the change from initial (time 0) fluorescence (ΔF/F0). (B) MIN6 cells were infected with adenovirus encoding preproinsulin-Venus (Insulin-V) without or with infection of adenovirus encoding HA-Exo8. After 2 d, the infected cells were preincubated with KRB at 37°C for 30 min and the images were acquired by TIRF microscopy every 82.9 ms over 10 min. Ninety seconds after image acquisition, the cells were stimulated by 60 mM KCl. The black columns correspond to the number of fusion events from “resident” granules within an evanescent field prior to the stimulation, whereas the white columns correspond to those from “passenger” granules that are newly recruited from the outside of an evanescent field and immediately fused to the plasma membrane. Data are expressed as means ± SEM (n = 9 for control cells and n = 4 for the cells expressing HA-Exo8). The statistical significance of differences was assessed by a Mann–Whitney U test (*, P < 0.05). (C) The fluorescence changes were measured in the center of Insulin-V–positive granules in MIN6 cells without (open squares) or with infection of adenovirus encoding HA-Exo8 (closed squares). The average fluorescence intensity after fusion was set equal to 100% (n = 7 each). (D) Insulin-V–positive granules were tracked during 30 s in a basal state starting at 1 min before stimulation (base) and during 30 s in a stimulated state starting at 30 s after 60 mM KCl stimulation (HK). The 2D diffusion coefficient Dx,y was derived from the slope of a curve in the MSD vs. time plot. Data are shown as box-plots: a box and a bar within the box indicate the 25–75% range and a median value, respectively, whereas outer bars represent minimum and maximum values. The statistical significance of differences was assessed by a Mann–Whitney U test (*, P < 0.05; **, P < 0.01).
FIGURE 7:
FIGURE 7:
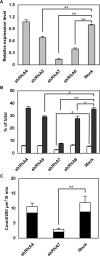
Effects of exophilin8 knockdown on insulin release from MIN6 cells. (A) Exophilin8 mRNA expression levels were determined by real-time quantitative PCR in MIN6 cells without or with infection of adenoviruses encoding exophilin8-specific shRNAs. The mean expression level in mock-treated cells was set at one. (B) MIN6 cells expressing exophilin8-specific shRNAs were incubated for 10 min with KRB (white bars) or KRB containing 60 mM KCl (black bars). The amount of insulin in the medium was normalized to total insulin content. (C) MIN6 cells expressing NPY-KO1 (n = 8) and those coexpressing noneffective shRNA4 (n = 7) or strongly effective shRNA7 (n = 6) were observed with a TIRF microscope. The NPY-KO1 images were acquired every 50 ms over 10 min in cells expressing shRNAs identified by EGFP fluorescence. Ninety seconds after image acquisition, the cells were stimulated by 60 mM KCl. The black columns correspond to the number of fusion events from “resident” granules, whereas the white columns correspond to those from “passenger” granules. Data are expressed as means ± SEM. The statistical significance of differences was assessed by a Mann–Whitney U test (*, P < 0.05; **, P < 0.01 vs. Mock).
FIGURE 8:
FIGURE 8:
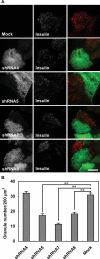
Effects of exophilin8 knockdown on insulin granule density near the plasma membrane. MIN6 cells were infected with recombinant adenovirus allowing expression of EGFP and the indicated exophilin8 shRNA. After 2 d, the infected cells as well as uninfected MIN6 cells were fixed and immunostained with anti–insulin antibody. (A) The cells were double-imaged for EGFP (left) and insulin (middle) with a TIRF microscope. Merged images were also shown (right). Bar, 10 μm. (B) The number of insulin granules identified in the evanescent field (calibrated at ∼100 nm from the coverslip) per adherent membrane area unit (200 μm2) are represented as means ± SEM (n = 41–54). The statistical significance of differences was assessed by a Mann–Whitney U test (**, P < 0.01 vs. Mock).

Similar articles

Cited by

References

    1. Desnos C, Huet S, Fanget I, Chapuis C, Böttiger C, Racine V, Sibarita J-B, Henry J-P, Darchen F. Myosin Va mediates docking of secretory granules at the plasma membrane. J Neurosci. 2007;27:10636–10645. - PMC - PubMed
    1. Desnos C, et al. Rab27A and its effector MyRIP link secretory granules to F-actin and control their motion towards release sites. J Cell Biol. 2003;163:559–570. - PMC - PubMed
    1. El-Amraoui A, Schonn J-S, Küssel-Andermann P, Blanchard S, Desnos C, Henry J-P, Wolfrum U, Darchen F, Petit C. MyRIP, a novel Rab effector, enables myosin VIIa recruitment to retinal melanosomes. EMBO Rep. 2002;3:463–470. - PMC - PubMed
    1. Fukuda M, Kuroda TS. Slac2-c (synaptotagmin-like protein homologue lacking C2 domains-c), a novel linker protein that interacts with Rab27, myosin Va/VIIa, and actin. J Biol Chem. 2002;277:43096–43103. - PubMed
    1. Fukuda M, Kuroda TS, Mikoshiba K. Slac2-a/melanophilin, the missing link between Rab27 and myosin Va: implications of a tripartite protein complex for melanosome transport. J Biol Chem. 2002;277:12432–12436. - PubMed

Publication types

MeSH terms