

CCR6hiCD11c(int) B cells promote M-cell differentiation in Peyer's patch
- PMID: 21422150
- PMCID: PMC3140262
- DOI: 10.1093/intimm/dxq478
CCR6hiCD11c(int) B cells promote M-cell differentiation in Peyer's patch
Abstract
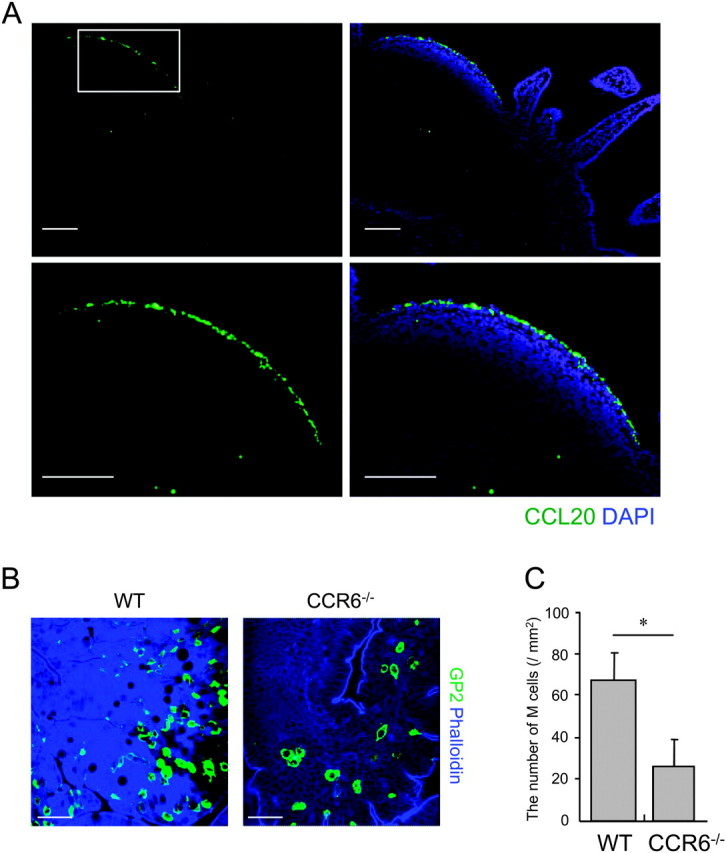
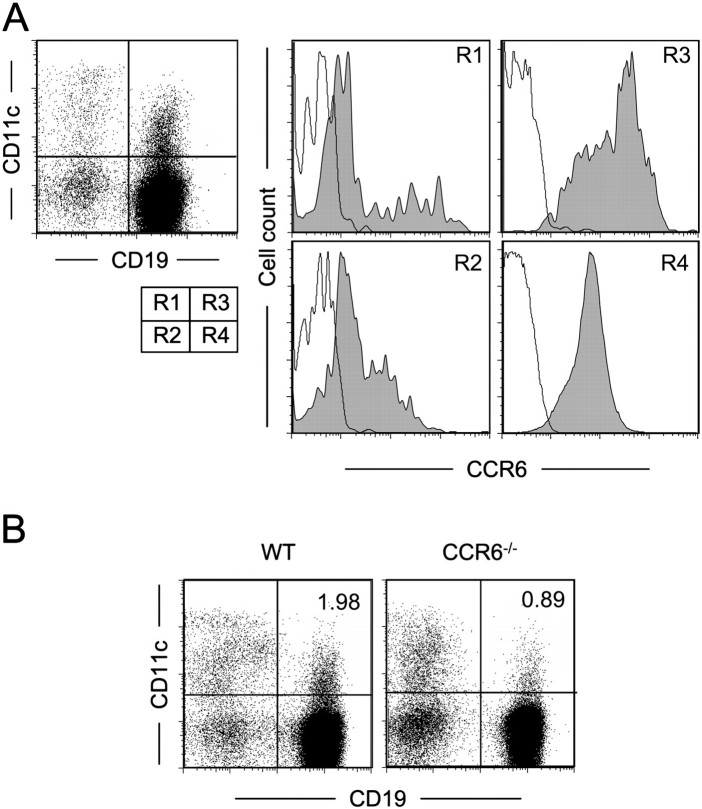
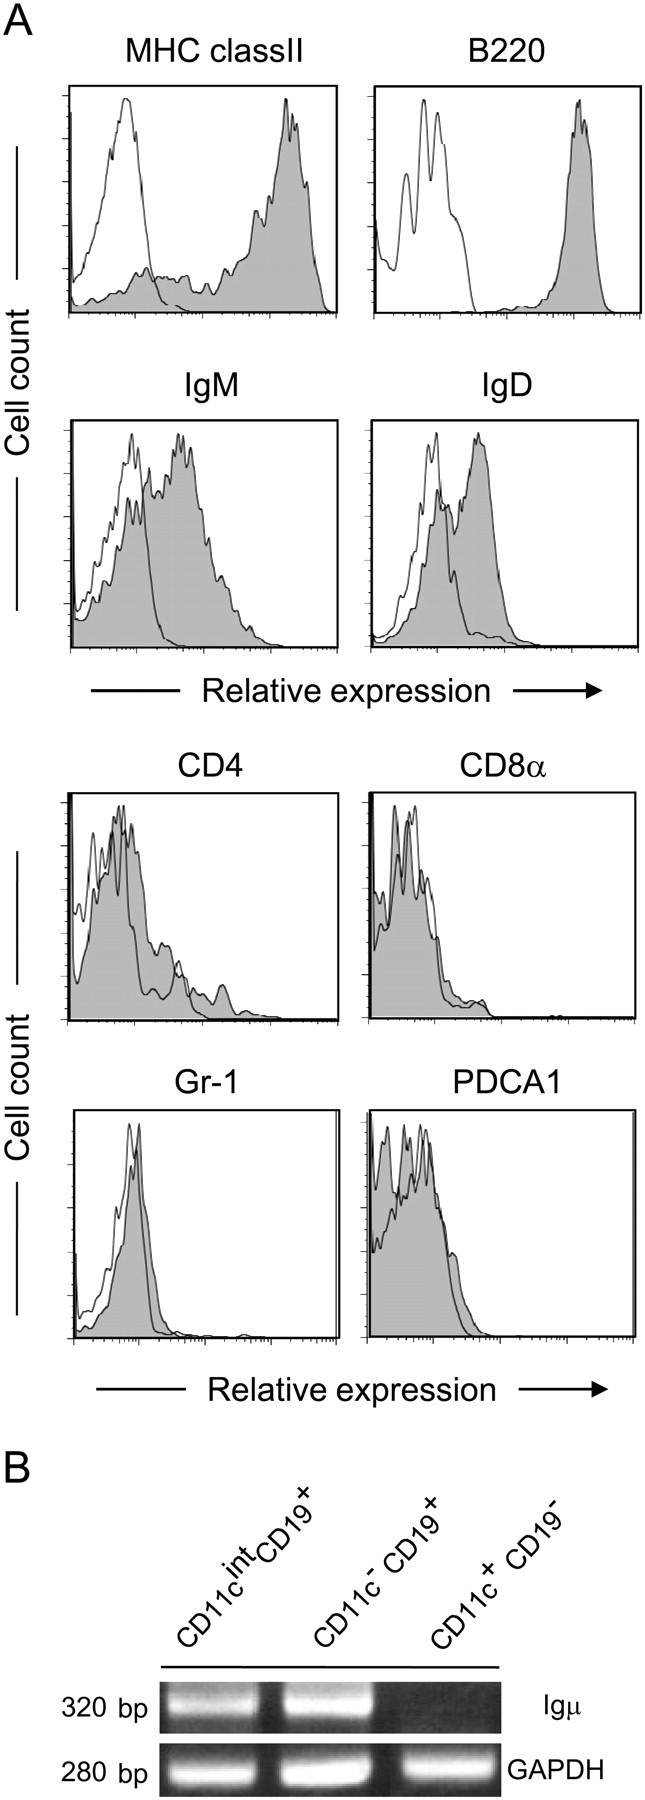
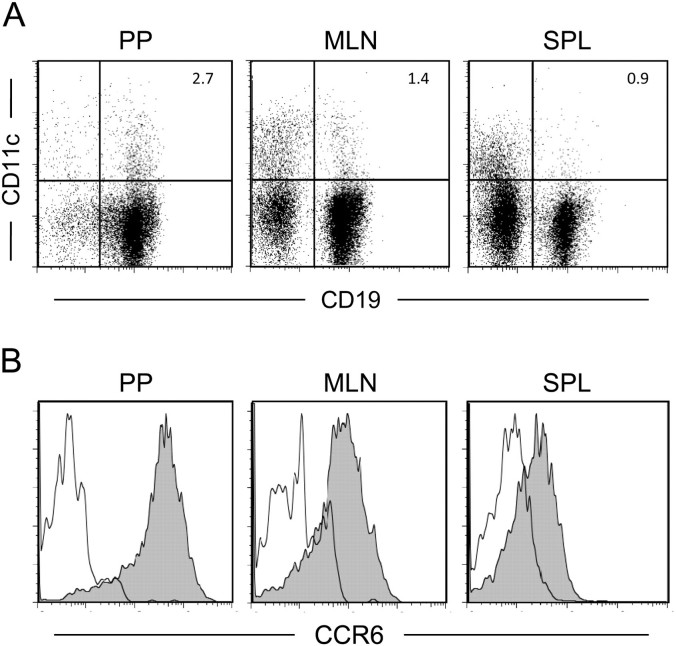
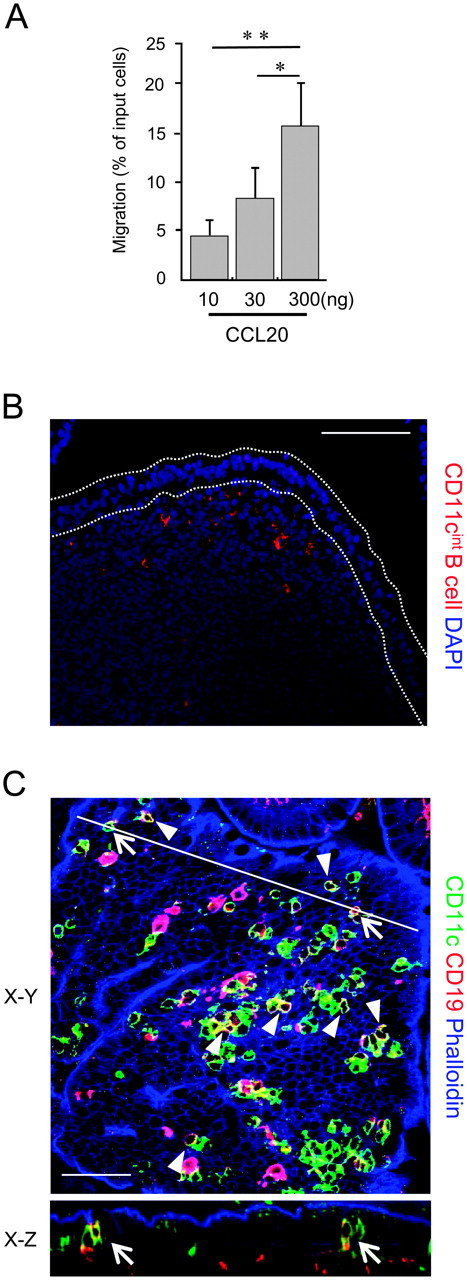
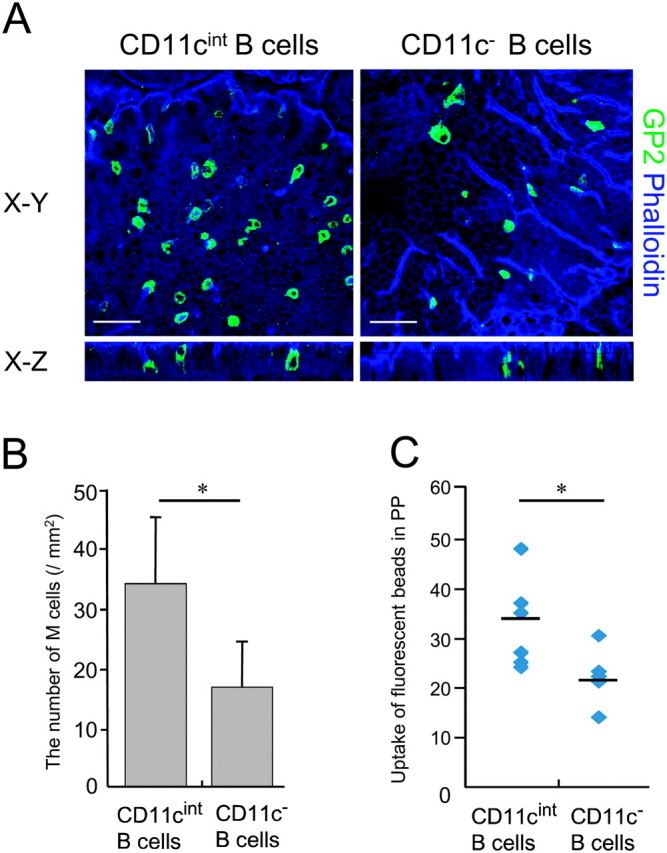
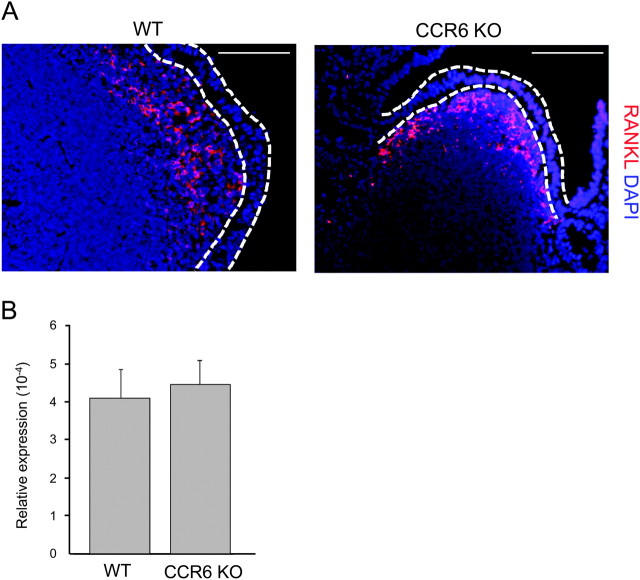
M cells are responsible for uptake of mucosal antigens in Peyer's patches (PPs). Differentiation of M cells is thought to be induced by interactions between follicle-associated epithelium and PP cells; however, it remains elusive what types of immune cells function as M-cell inducers. Here, we attempted to identify the cells that serve as an M-cell inducer in PP. We found that a unique B-cell subset characterized by CCR6(hi)CD11c(int) resided in the subepithelial dome (SED) in mouse PP. CCR6(hi)CD11c(int) B cells showed chemotactic migration in response to CCL20. Furthermore, this unique B-cell subset substantially decreased in PP of CCR6-deficient mice, indicating that the SED localization of CCR6(hi)CD11c(int) B cells is most likely regulated by the CCL20-CCR6 system. Concomitantly, CCR6 deficiency caused remarkable decrement of M cells. Moreover, adoptive transfer of CCR6(hi)CD11c(int) B cells from wild-type mice restored the M-cell decrement in CCR6-deficient mice. Collectively, the spatial regulation of CCR6(hi)CD11c(int) B cells via the CCL20-CCR6 system may play a vital role in M-cell differentiation in mice.
Figures
Similar articles
-
CCL9 is secreted by the follicle-associated epithelium and recruits dome region Peyer's patch CD11b+ dendritic cells.J Immunol. 2003 Sep 15;171(6):2797-803. doi: 10.4049/jimmunol.171.6.2797. J Immunol. 2003. PMID: 12960300
-
Absence of CCR6 inhibits CD4+ regulatory T-cell development and M-cell formation inside Peyer's patches.Am J Pathol. 2005 Jun;166(6):1647-54. doi: 10.1016/S0002-9440(10)62475-3. Am J Pathol. 2005. PMID: 15920150 Free PMC article.
-
CC chemokine receptor 6 expression by B lymphocytes is essential for the development of isolated lymphoid follicles.Am J Pathol. 2007 Apr;170(4):1229-40. doi: 10.2353/ajpath.2007.060817. Am J Pathol. 2007. PMID: 17392163 Free PMC article.
-
CCR6 and CCL20: partners in intestinal immunity and lymphorganogenesis.Ann N Y Acad Sci. 2006 Aug;1072:52-61. doi: 10.1196/annals.1326.036. Ann N Y Acad Sci. 2006. PMID: 17057190 Review.
-
Development of Peyer's patches, follicle-associated epithelium and M cell: lessons from immunodeficient and knockout mice.Semin Immunol. 1999 Jun;11(3):183-91. doi: 10.1006/smim.1999.0174. Semin Immunol. 1999. PMID: 10381864 Review.
Cited by
-
The functional maturation of M cells is dramatically reduced in the Peyer's patches of aged mice.Mucosal Immunol. 2013 Sep;6(5):1027-37. doi: 10.1038/mi.2012.141. Epub 2013 Jan 30. Mucosal Immunol. 2013. PMID: 23360902 Free PMC article.
-
The development and function of mucosal lymphoid tissues: a balancing act with micro-organisms.Mucosal Immunol. 2014 May;7(3):455-66. doi: 10.1038/mi.2014.11. Epub 2014 Feb 26. Mucosal Immunol. 2014. PMID: 24569801 Review.
-
Modulation of chemokine expression on intestinal epithelial cells by Kampo (traditional Japanese herbal) medicine, Hochuekkito, and its active ingredients.J Nat Med. 2013 Jul;67(3):626-35. doi: 10.1007/s11418-012-0724-1. Epub 2012 Dec 1. J Nat Med. 2013. PMID: 23203627
-
Microbial Stimulation Reverses the Age-Related Decline in M Cells in Aged Mice.iScience. 2020 Jun 26;23(6):101147. doi: 10.1016/j.isci.2020.101147. Epub 2020 May 11. iScience. 2020. PMID: 32454449 Free PMC article.
-
Food components and the immune system: from tonic agents to allergens.Front Immunol. 2013 May 17;4:102. doi: 10.3389/fimmu.2013.00102. eCollection 2013. Front Immunol. 2013. PMID: 23730302 Free PMC article.
References
-
- Kraehenbuhl JP, Neutra MR. Epithelial M cells: differentiation and function. Annu. Rev. Cell Dev. Biol. 2000;16:301. - PubMed
-
- Kerneis S, Pringault E. Plasticity of the gastrointestinal epithelium: the M cell paradigm and opportunism of pathogenic microorganisms. Semin. Immunol. 1999;11:205. - PubMed
-
- Kanaya T, Miyazawa K, Takakura I, et al. Differentiation of a murine intestinal epithelial cell line (MIE) toward the M cell lineage. Am. J. Physiol. Gastrointest. Liver Physiol. 2008;295:G273. - PubMed
Publication types
MeSH terms
Substances
Grants and funding
LinkOut - more resources
Full Text Sources
Molecular Biology Databases
Research Materials
Miscellaneous
