. 2011 May 20;408(5):949-70.
doi: 10.1016/j.jmb.2011.03.020. Epub 2011 Mar 17.

Probing the determinants of diacylglycerol binding affinity in the C1B domain of protein kinase Cα

Affiliations

Probing the determinants of diacylglycerol binding affinity in the C1B domain of protein kinase Cα

Mikaela D Stewart et al. J Mol Biol. .

Abstract

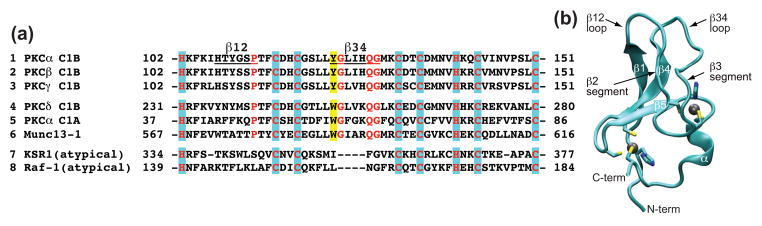
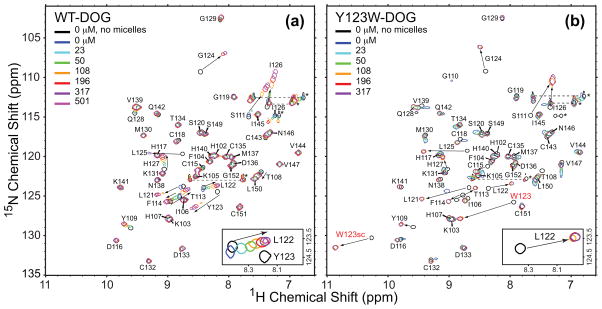
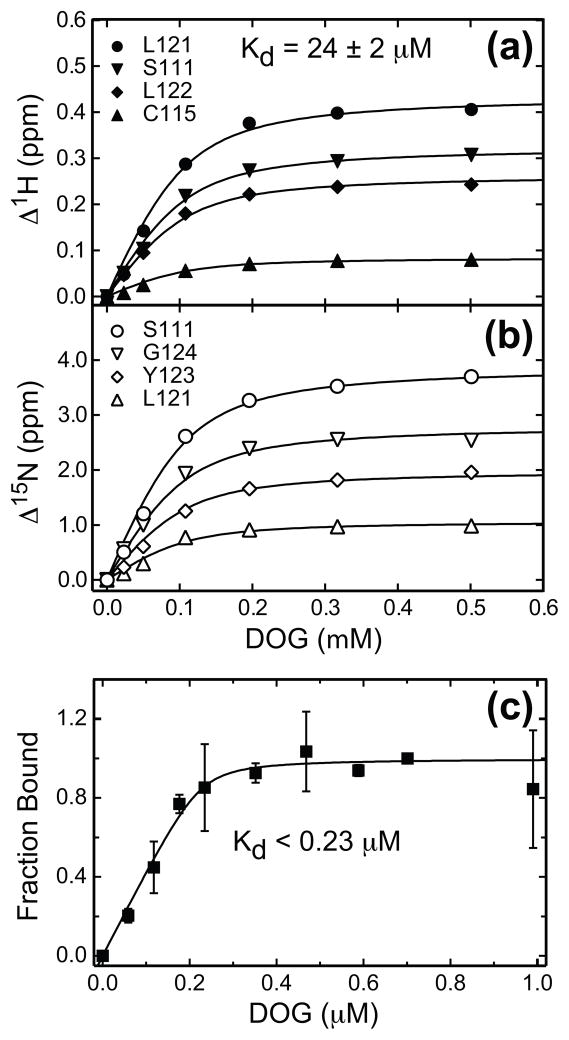
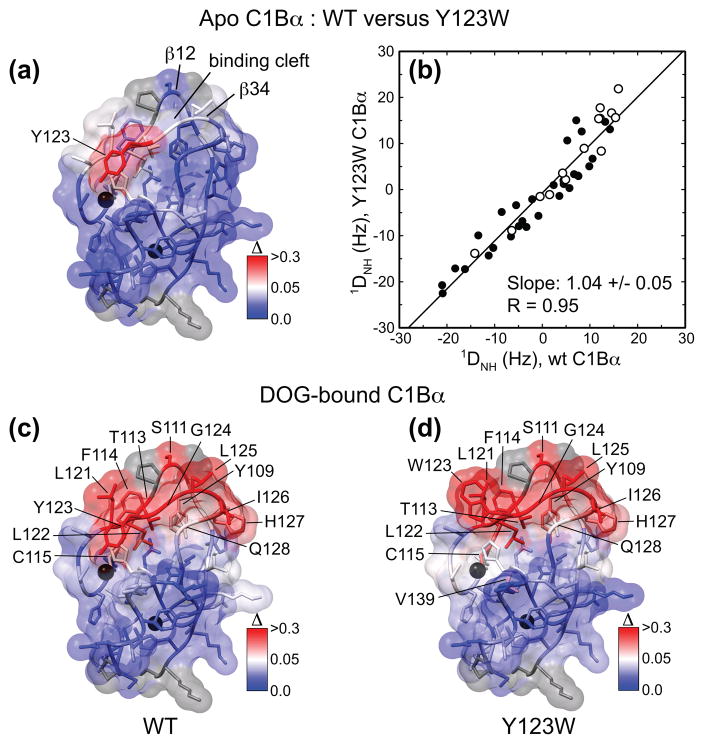
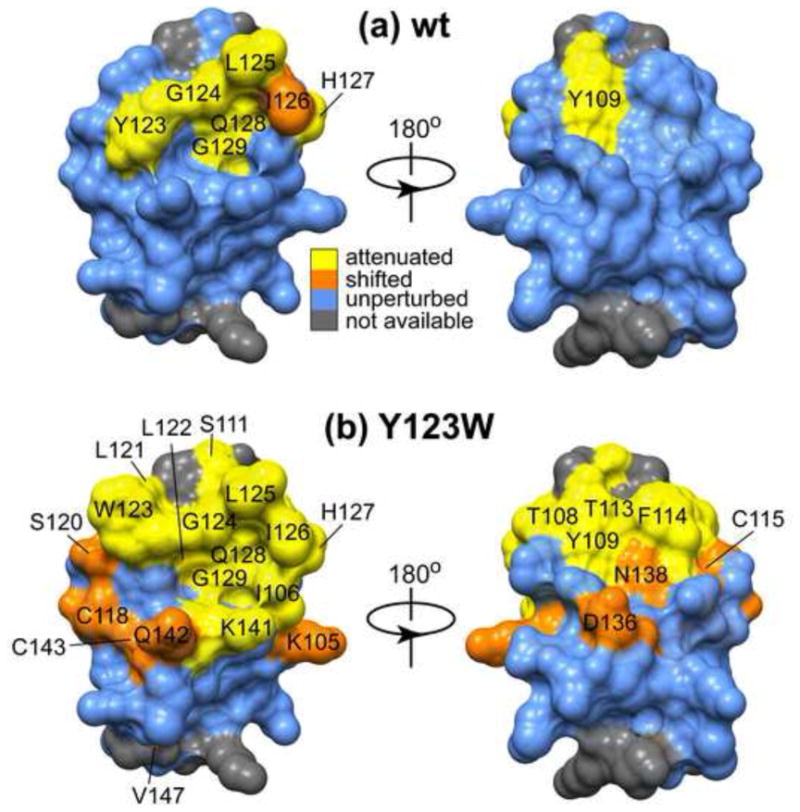
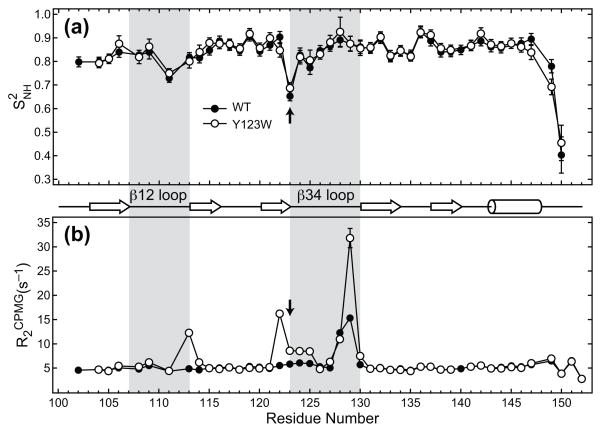
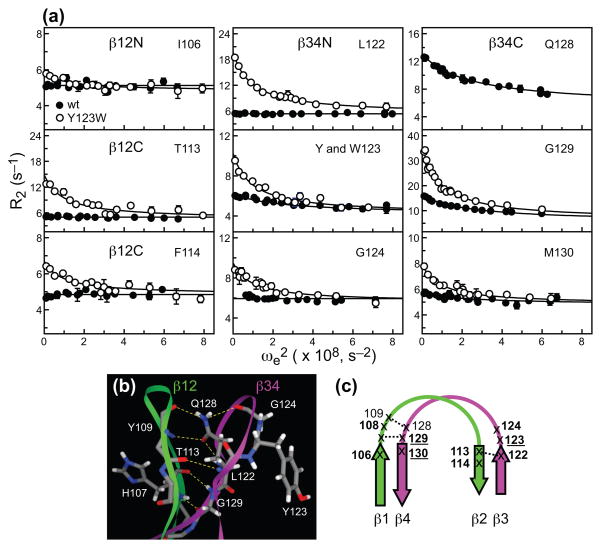
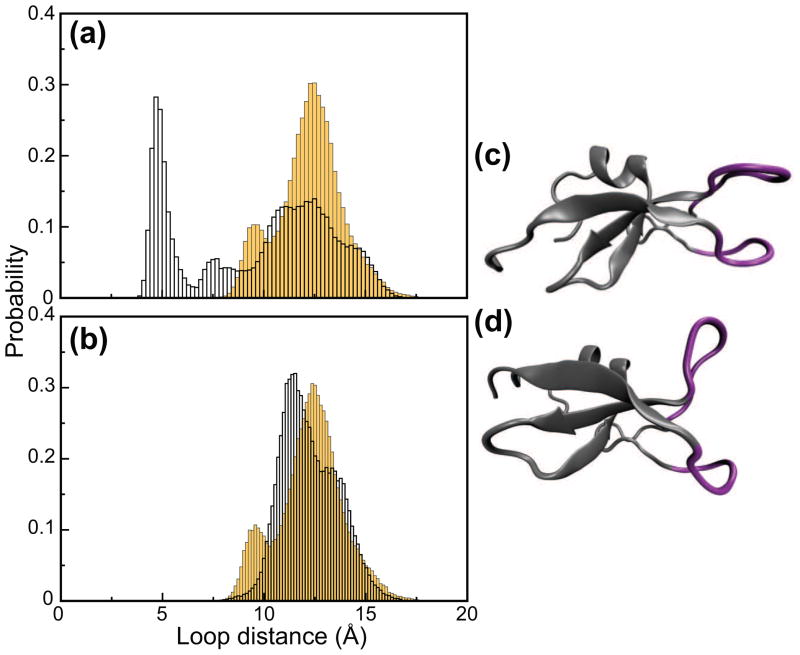
C1 domains are independently folded modules that are responsible for targeting their parent proteins to lipid membranes containing diacylglycerol (DAG), a ubiquitous second messenger. The DAG binding affinities of C1 domains determine the threshold concentration of DAG required for the propagation of signaling response and the selectivity of this response among DAG receptors in the cell. The structural information currently available for C1 domains offers little insight into the molecular basis of their differential DAG binding affinities. In this work, we characterized the C1B domain of protein kinase Cα (C1Bα) and its diagnostic mutant, Y123W, using solution NMR methods and molecular dynamics simulations. The mutation did not perturb the C1Bα structure or the sub-nanosecond dynamics of the protein backbone, but resulted in a >100-fold increase in DAG binding affinity and a substantial change in microsecond timescale conformational dynamics, as quantified by NMR rotating-frame relaxation-dispersion methods. The differences in the conformational exchange behavior between wild type and Y123W C1Bα were localized to the hinge regions of ligand-binding loops. Molecular dynamics simulations provided insight into the identity of the exchanging conformers and revealed the significance of a particular residue (Gln128) in modulating the geometry of the ligand-binding site. Taken together with the results of binding studies, our findings suggest that the conformational dynamics and preferential partitioning of the tryptophan side chain into the water-lipid interface are important factors that modulate the DAG binding properties of the C1 domains.


Figures

Figure 1
Figure 1
(a) Comparison of the primary structures of DAG/PE-responsive (1 through 6) and “atypical” (7 and 8) C1 domains. C1Bα numbering is used to indicate the amino acid position in the primary structure. Consensus sequence for DAG/PE-responsive C1 domains, shown in red, comprises residues involved in coordinating two structural Zn2+ ions (highlighted in blue), Pro112, Gly124, and the Gln128-Gly129 motif. DAG-binding loops β12 and β34 are underlined in C1Bα. Loop β34 in atypical C1 domains from KSR-1 and Raf-1 has a four amino-acid deletion., A conserved Tyr at position 123 is highlighted in yellow. All C1 sequences are from Mus musculus except for Raf1, which is from Homo sapiens. (b) Ribbon representation of the ensemble-averaged NMR structure of C1Bα. The coordinates were kindly provided by Dr. Ulrich Hommel. β2 and β3 segments are identified as 3-amino acid β-strands by Hommel et al., and will be referred to as such in the remainder of the paper.
Figure 2
Figure 2
NMR-detected titration of the wt (a) and Y123W C1Bα (b) with DOG in the presence of DPC/DPS micelles. The binding process is intermediate-to-fast and slow-to-intermediate on the chemical-shift timescale for the wt and Y123W C1Bα, respectively. The insets show the differences in the binding regimes for the wt and mutant proteins using Leu122 as an example. Large chemical shift perturbations are observed in the ligand-bound versus apo-spectra.
Figure 3
Figure 3
DOG binding curves for the wt and Y123W C1Bα detected by NMR and fluorescence spectroscopy. In (a) and (b), the absolute values of the 1H and 15N chemical shift changes, Δ1H and Δ15N, are plotted as a function of DOG concentration for several representative residues. The binding curves were fit with Eq. (1) using the dissociation constant Kd as a global parameter. (c) Normalized change in the fluorescence of Y123W C1Bα plotted as a function of DOG concentration. The error bars represent the standard deviation between three experiments. Fitting the binding curve with Eq. (8) produced P0 of 0.23 ± 0.07 μM and Kd of 6.7 ± 16.4 nM. Large errors in Kd indicate that, in this protein concentration range, the binding is still tight, and we can only put an upper limit of 0.23 μM onto the Kd value.
Figure 4
Figure 4
Assessment of structural differences between wt and Y123W C1Bα using chemical shift perturbation analysis and RDCs. Structural Zn2+ ions are shown as black spheres in (a), (c), and (d). Prolines and residues that are missing from the 15N-1H HSQC spectra are shown in grey. In (a), Δ was calculated between the apo-forms of Y123W and wt C1Bα, color-coded and mapped onto the ensemble-averaged NMR structure of C1Bα. The only significant perturbation is observed at the mutation site. (b) Comparison of the 1DNH RDCs between the Y123W and wt C1Bα. Empty circles correspond to the β12 and β34 loop residues. Fitting the data with a linear function produces a slope of 1.0 within experimental error, suggesting that minimum perturbations are imposed on the backbone of C1Bα by the Y123W mutation. In (c) and (d), Δ was calculated between the DOG-bound and apo forms of wt (c) and Y123W C1Bα (d). In both proteins, the regions involved in interactions with ligand are the β12 and β34 loops and their hinges. In (d), the Tyr at position 123 was replaced with Trp in the ensemble-averaged NMR structure of C1Bα using WHATIF.
Figure 5
Figure 5
Mapping of the interaction surface of wt (a) and Y123W C1Bα (b) with ligand-free micelles. The cross-peaks of residues that interact with DPC/DPS micelles are either significantly attenuated (yellow) or shifted (orange) compared to their positions in the micelle-free spectra. (a) In wt C1Bα, the entire loop β34, comprising residues Tyr123-Gly129, and Tyr109 of loop β12 are involved in the interactions with micelles. (b) In Y123W C1Bα, both β12 and β34 loops and several adjacent residues are involved in the interactions with micelles. In (b), the Tyr at position 123 was replaced with Trp in the ensemble-averaged NMR structure of C1Bα using WHATIF. Overall, the total surface area involved in the interaction with micelles is larger in the mutant than in the wt C1Bα.
Figure 6
Figure 6
(a) Comparison of the sub-ns dynamics of 15N-1H backbone groups in the wt and Y123W C1Bα. The generalized order parameters, S2NH, are plotted as a function of primary structure. Shaded areas correspond to β12 and β34 loops, and the mutation site is indicated with an arrow. It is evident from the plot that sub-nanosecond dynamics of the protein backbone are not perturbed by the Y123W mutation. (b) Comparison of the R2CPMG values for the wt and Y123W C1Bα. Elevated R2CPMG values indicate the presence of conformational exchange on the μs-ms timescale. In wt C1Bα, the most dynamic region is the C-terminal hinge of loop β34, while in the Y123W mutant it is both hinges of β34 and the C-terminal hinge of β12.
Figure 7
Figure 7
Comparison of conformational dynamics in wt and Y123W C1Bα. (a) Comparison of relaxation dispersion curves for individual residues in wt (solid circles) and Y123W C1Bα (empty circles). For clarity, only the 14.1 Tesla data are shown. The solid lines correspond to the global fits with parameters summarized in Table 1. Residue groups are defined in Table 1. (b) Intra- and inter-loop hydrogen bonds that stabilize β12 and β34. Because the loop region in the NMR ensemble of C1Bα is poorly defined, we used a homology model of C1Bα that is based on the structure of C1Bδ (1PTQ). Five residues that show quantifiable dispersion amplitudes in either wt or mutant C1Bα, Thr113, Leu122, Gly124, Gln128, and Gly129, are involved in those hydrogen bonds. (c) Conformational dynamics of loop hinges in β12 and β34. Residues that have quantifiable dispersion in both wt and mutant are underlined. Residues with quantifiable dispersion in either wt or mutant are shown with regular and bold fonts, respectively.
Figure 8
Figure 8
Distribution of open and closed loop conformations in C1Bα. (a) Histogram of the distances between the loop tips for the wt (yellow bars) and Y123W C1Bα (empty bars) observed during the interval between 2 and 10 ns of the MD trajectories. The distance between the loop tips is measured every 200 fs. Wt C1Bα shows a broad bimodal distribution centered at 12.5 Å and 9.5 Å, respectively. Y123W C1Bα has two preferred conformations: the open and closed, which are centered at 12.5 Å and 5 Å. (b) Histogram of the distances between the loop tips for the Y123W C1Bα (empty bars) observed during the trajectory interval between 10 and 18 ns, after the opening of the binding loops. The distance between the loop tips is measured every 200 fs. For comparison, the histogram generated using the three original 8 ns long trajectories of wt C1Bα is shown on the same plot (yellow bars). Both wt and Y123W C1Bα sample open or partially open conformations that show a bimodal distribution. Frequent transitions between open and partially open conformations are observed along the trajectories. Snapshots of the structures with closed and open loop conformations are shown in (c) and (d), respectively. Loop regions are highlighted in purple.
Figure 9
Figure 9
χ2 transitions and hydrogen bonds of Gln128 sidechain in wt C1Bα. (a) χ2 dihedral angle of Gln128 shown as a function of time for one of the wt C1Bα trajectories. (b) Hydrogen bonds formed by Gln128 for the same trajectory. The presence of a given hydrogen bond at any time point in the trajectory is indicated with a vertical line. The residues shown in italics have their sidechain atoms involved in the formation of hydrogen bonds. The residues shown in bold are involved in the formation of inter-loop hydrogen bonds. The χ2 transitions that occur at 4.4 and 6.5 ns correlate with the rearrangement of the hydrogen-bonding network of Gln128.

Similar articles

Cited by

References

    1. Hurley JH, Newton AC, Parker PJ, Blumberg PM, Nishizuka Y. Taxonomy and function of C1 protein kinase C homology domains. Protein Sci. 1997;6:477–480. - PMC - PubMed
    1. Brose N, Rosenmund C. Move over protein kinase C, you’ve got company: alternative cellular effectors of diacylglycerol and phorbol esters. J Cell Sci. 2002;115:4399–4411. - PubMed
    1. Kazanietz MG. Targeting protein kinase C and “non-kinase” phorbol ester receptors: emerging concepts and therapeutic implications. Biochim Biophys Acta. 2005;1754:296–304. - PubMed
    1. Blumberg PM, Kedei N, Lewin NE, Yang D, Czifra G, Pu Y, Peach ML, Marquez VE. Wealth of opportunity - the C1 domain as a target for drug development. Curr Drug Targets. 2008;9:641–652. - PMC - PubMed
    1. Goel G, Makkar HP, Francis G, Becker K. Phorbol esters: structure, biological activity, and toxicity in animals. Int J Toxicol. 2007;26:279–288. - PubMed

Publication types

LinkOut - more resources