. 2011 Feb 23;31(8):2855-67.
doi: 10.1523/JNEUROSCI.6064-10.2011.

Imaging light responses of targeted neuron populations in the rodent retina

Affiliations

Imaging light responses of targeted neuron populations in the rodent retina

Bart G Borghuis et al. J Neurosci. .

Abstract

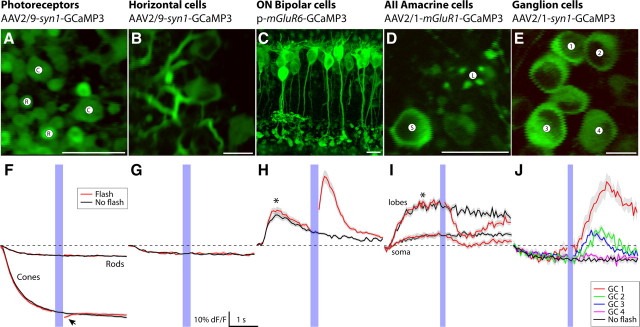
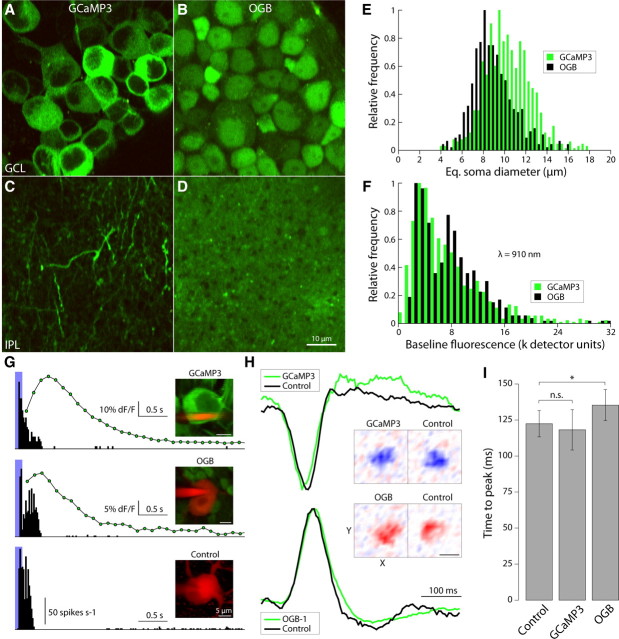
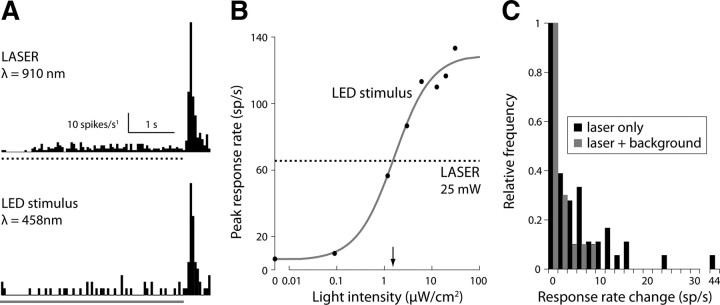
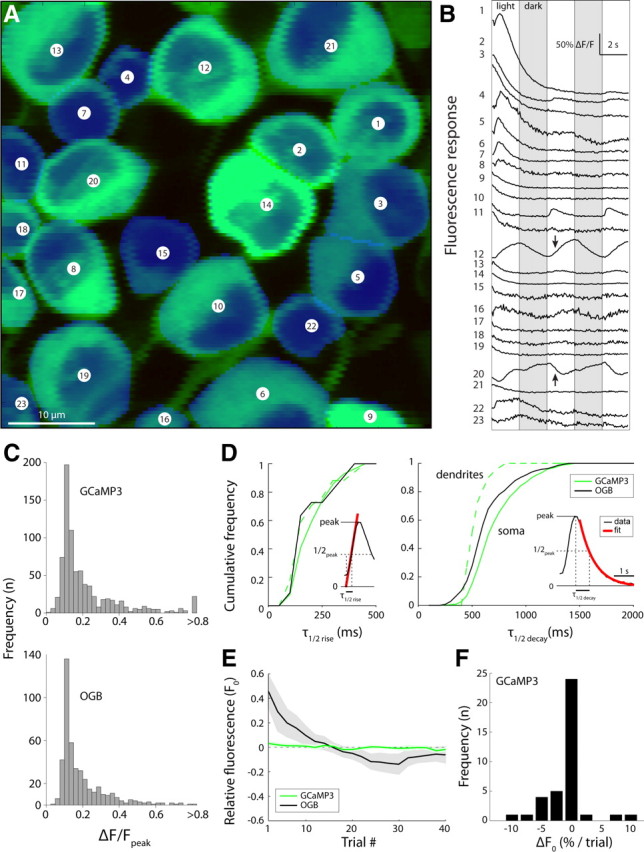
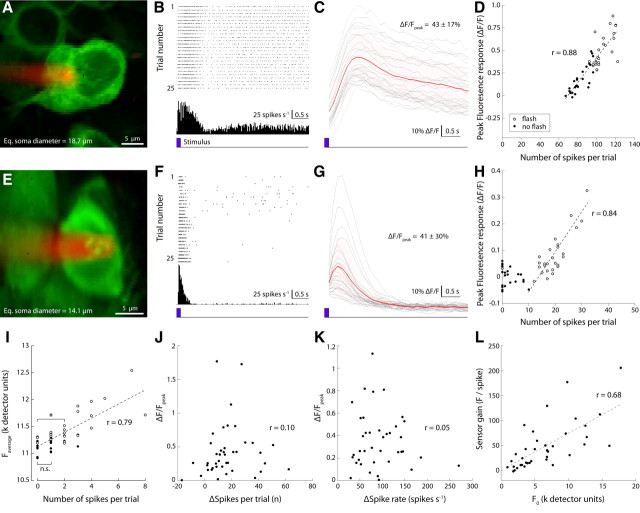
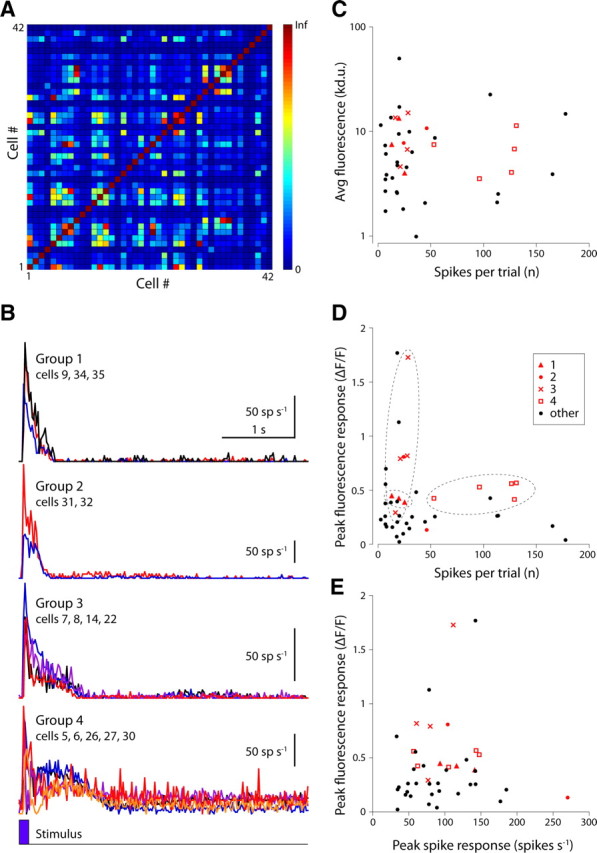
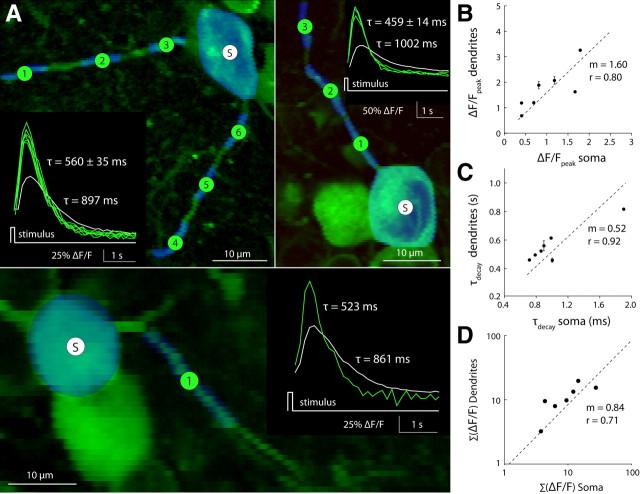
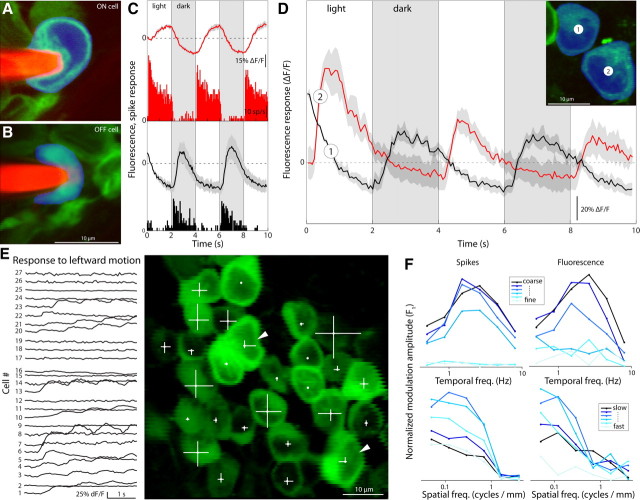
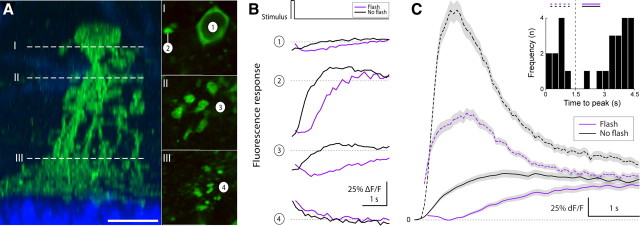
Decoding the wiring diagram of the retina requires simultaneous observation of activity in identified neuron populations. Available recording methods are limited in their scope: electrodes can access only a small fraction of neurons at once, whereas synthetic fluorescent indicator dyes label tissue indiscriminately. Here, we describe a method for studying retinal circuitry at cellular and subcellular levels combining two-photon microscopy and a genetically encoded calcium indicator. Using specific viral and promoter constructs to drive expression of GCaMP3, we labeled all five major neuron classes in the adult mouse retina. Stimulus-evoked GCaMP3 responses as imaged by two-photon microscopy permitted functional cell type annotation. Fluorescence responses were similar to those measured with the small molecule dye OGB-1. Fluorescence intensity correlated linearly with spike rates >10 spikes/s, and a significant change in fluorescence always reflected a significant change in spike firing rate. GCaMP3 expression had no apparent effect on neuronal function. Imaging at subcellular resolution showed compartment-specific calcium dynamics in multiple identified cell types.


Figures

Figure 1.
Figure 1.
Schematic of the visual stimulation method. A–C, The retina was stimulated with one of the following two methods: (1) a LED light source to present brief, spatially uniform flashes; or (2) a miniature DLP to present spatiotemporal patterns. Light emitted by the blue LED (peak wavelength at 458 nm) was not filtered before the retina (B, black curve). The broad-spectrum light output of the DLP projector (B, blue dotted line) was bandpass filtered to block wavelengths >460 nm (Brightline 440/40; Semrock). Stimulus light was passed through a variable neutral density filter to control average intensity at the retina. Light entering the “green” PMT was filtered with two dichroic mirrors (DMs) (Chroma Technology), with bandpasses set to collect GCaMP fluorescence [long wavelength (“red”) collecting photon multiplier tube (PMT) omitted for clarity]. The long-wavelength tail of the LED emission extended into the green, and a significant amount of its light entered the PMT (C) (inset shows same data in detail). This precluded fluorescence data collection during LED stimulation but permitted stimulating both UV and green cone photoreceptors. DLP emission at wavelengths >460 nm was blocked after the projector, and DLP light reaching the PMT was negligible at intensities <1 mW/cm2 at the retina (equivalent to ambient light under a clouded sky at noon).
Figure 2.
Figure 2.
Summary of vectors and their target neurons in mouse retina. For each retinal neuron class (top), we identified a vector that targets gene expression to some or all of its constituent neuron types. A–E, Fluorescence images of GCaMP3-expressing neurons representative for each class. Two-photon microscopy resolved all labeled structures with submicrometer resolution. Images represent the average fluorescence image obtained from 3 to 10 no-flash trials (<2 min recording time). Scale bar, 10 μm. D, Cross section through soma (S) and lobular appendage (L) of a labeled type AII amacrine cell. F–J, Stimulus evoked fluorescence responses representative for the labeled neuron types shown in A–E. Flash, Fluorescence response to a brief blue light flash (458 nm LED, 125 ms duration, 100 μW/cm2); no flash, scan laser only (red and black solid lines; average ± 1 SD shown in gray). The traces show the fluorescence response measured from the respective images shown in A–E, except the bipolar cells, where an image obtained from retinal slice is shown for clarity, while fluorescence was recorded from a dendritic arbor in a whole-mount retina [arbor shown (see Notes)]. F, Fluorescence signal in cone terminals decreased from scan laser onset; the arrowhead indicates additional fluorescence decrease in response to the LED stimulus. H, I, The asterisks indicate fluorescence response evoked by scan laser onset. J, Responses recorded from four different ganglion cells (annotated in E; not all cells shown for clarity). Fluorescence signals show response heterogeneity expected from different ganglion cell types. Movie clips for these recordings can be viewed online (see Notes).
Figure 3.
Figure 3.
AAV2/1-synapsin-1-mediated expression patterns in the mouse retina. Laser-scanning confocal microscope images of GCaMP3 expression (green) 2 weeks after intravitreal injection of AAV2/1-syn1-GCaMP3 into adult mouse eyes. Tissues were counterstained with the nuclear stain DAPI (blue). A, An injection volume of 0.75 μl typically gave a spotted transfection pattern, with several clusters of ∼20–100 brightly labeled cells (white box magnified in B) distributed across the retina. The superficial fiber layer showed bundles of fluorescent axons converging on the optic disc (open arrowhead). Almost all transfected retinas showed labeled cells concentrated at the perimeter of the optic disc (solid arrowhead). B, Higher magnification of the boxed area in A. C, A greater injection volume (1.0–2.0 μl) often gave more uniform labeling, faster expression, and generally higher expression levels (not quantified). Scale bars: A, C, 1.0 mm; B, 25 μm.
Figure 4.
Figure 4.
AAV2/1-syn1-GCaMP3 labels a subset of neurons in the ganglion cell layer and permits imaging with tolerably low laser power. A–D, Two-photon fluorescence images of neuronal somas in the ganglion cell layer (GCL) (A, B) and their dendrites in the IPL (C, D). A, B, Image at the level of the GCL showing somas of GCaMP3-expressing ganglion cells (A) and somas of ganglion cells 60 min after bulk loading with OGB-1-AM (B). C, D, Inner plexiform layer of a retina with GCaMP3-expressing ganglion cells (C) and a retina 60 min after bulk loading with OGB-1-AM (D). E, Distribution of soma sizes of neurons in the ganglion cell layer labeled with GCaMP3 (green) and OGB (black). Soma size is expressed as the equivalent soma diameter (i.e., the diameter of a disc with surface area equal to that of the soma in the fluorescence image). F, Distribution of baseline (nonstimulated) fluorescence intensity for each soma, at typical laser power (∼25 mW after objective). G, Extracellularly recorded spike responses (peristimulus time histogram) of an α-type (brisk transient) ganglion cell expressing GCaMP3 (top), one bulk loaded with OGB-1-AM (middle), and a control cell (nontransfected retina; bottom), stimulated with a brief light flash (458 nm, 125 ms duration, 100 μW/cm2; indicated in blue). For the GCaMP3- and OGB-labeled cells, graphs include the simultaneously recorded fluorescence response (7 Hz frame rate; green circles and black curve). H, Spatiotemporal filters calculated from OFF-type (top) and ON-type ganglion cells (bottom) stimulated with a binary white noise stimulus. Curves show spike temporal response characteristic of the receptive field center; X–Y plots represent the spatial weighting function measured at the temporal response peak of each cell. Scale bar, 200 μm. I, Filter time-to-peak across the recorded ganglion cell population (all brisk transient-type; each group n = 6). n.s., Not significant (t test, p = 0.34). *Significant (t test, p = 0.002). Error bars indicate SEM.
Figure 5.
Figure 5.
Light-adapting background minimized scan laser-evoked light responses. A, Peristimulus time histogram of an OFF-type ganglion cell spike response to the scan laser (top, dotted line) and blue LED (bottom, blue line). The cell responds strongly when either stimulus is turned off. B, Peak amplitude of the response evoked by the scan laser (dotted line), and LED stimulus at increasing intensity (black dots; blue curve, sigmoidal fit: basis e−1/x expanded with two offset parameters and one linear scale parameter). Response amplitudes matched at a visible light intensity of ∼1.7 μW/cm2 (arrow), equivalent to 400 photoisomerizations/s per M-cone. C, Changes in ganglion cell spike rate evoked by the scanning laser in the presence (n = 16 cells; blue) and absence (n = 48 cells; black) of adapting background illumination (2.5 μW/cm2; 440 ± 20 nm; LED light source). Adding the background eliminated the high spike frequencies characteristic of the response to laser scanning.
Figure 6.
Figure 6.
Light-evoked response dynamics of GCaMP3- and OGB-labeled neuronal populations are similar. A, Two-photon laser-scanning image of GCaMP3-expressing retinal ganglion cells counterstained with DAPI. Responses to full-field flicker (2 s switch interval) were imaged for the 23 retinal ganglion cell somas in the field of view. B, Fluorescence responses recorded during stimulation with full-field flicker (respective light and dark phases indicated by white and gray columns) recorded from the 23 cells shown in A. Responses are ordered by the sign (ON, top; OFF, bottom), magnitude, and delay (sluggish top, brisk middle) of the light-evoked fluorescence response. C, Peak fluorescence response histograms for GCaMP3 (top)- and OGB (bottom)-labeled cells are similar. D, Cumulative frequency histograms of fluorescence response kinetics for GCaMP3 (solid green)- and OGB (black)-labeled somas, and for GCaMP3-labeled dendrites (dashed green). Left, Rise kinetics; right, decay kinetics. Insets, Fits for t1/2 (rise) and t1/2 (decay). E, Change in basal fluorescence intensity during repeated laser scanning. Scan duration was 5 s with a 1.5 s interval between scans. Relative fluorescence was calculated as the fractional change in the fluorescence intensity of a cell relative to its fluorescence intensity averaged over all trials (ΔF0/〈F0〉). The shaded areas represent mean ± 1 SEM (GCaMP3, n = 42; OGB-1, n = 11). F, Histogram of basal fluorescence change per trial. Average percentage change was obtained from a linear fit to the fluorescence intensity of a cell in subsequent 5 s trials (GCaMP3 data only; n = 42).
Figure 7.
Figure 7.
GCaMP3 signal gain and linearity vary across the recorded ganglion cell population. A, Two-photon image of an extracellularly recorded GCaMP3-expressing retinal ganglion cell (RGC) (green); Alexa Fluor 568-filled pipette (red). B, Raster plot of the response of the cell to stimulation with a brief light flash (458 nm LED; 125 ms duration; 100 μW/cm2) at trial onset (bottom trace, blue). Twenty-five single trial spike trains are shown. C, Change in fluorescence intensity (ΔF/F) recorded simultaneously with the spike responses shown in B (red, average; shaded light red, SEM of average; gray, single trials). D, Average fluorescence change during each trial (5 s duration) plotted against the total number of spikes fired during that trial. Open circles, Trials in which a brief light flash was presented; filled circles, control trials (no light flash). E–H, Results from a different RGC. Note rectification of the GCaMP3 signal at spike counts <10. I, Example of a ganglion cell recording (morphology not shown) with negligible rectification at low spike counts. The fluorescence intensity during trials in which the cell fired two spikes was significantly greater than during trials in which the cell fired no spikes (p = 0.006, t test). The signal difference between trials with no spikes and trials with a single spike was not significant (p = 0.099, t test). Detector units represent the 12 bit fluorescence intensity value signaled by the photomultiplier tube. J, Correlation between the change in number of spikes fired relative to spontaneous rate and peak fluorescence change of the recorded population (n = 42). Each dot represents a single neuron, with the spike count and peak fluorescence change averaged over all recorded trials (4–30 repeats) (for details, see Results). K, Correlation between change in fluorescence and change in peak spike rate (same data as shown in J). L, Correlation between fluorescence gain (slope of linear fits as shown in D and H) and baseline fluorescence (see text for details).
Figure 8.
Figure 8.
Sensor gain varied across ganglion cells of the same functional type. Ganglion cells were grouped by functional type based on their spike response to a brief light flash. A, Similarity (see Results for details) of flash-evoked spike responses for all pairwise combinations of recorded cells (n = 42). B, Spike responses of all cells in each of four different groups (averaged into 50 ms bins). Each trace represents the average flash-evoked spike response (>10 repeats) of a single ganglion cell. The plot includes data shown in Figure 7. C–E, Scatter plots of various representations of the fluorescence response gain for all recorded cells (n = 42). Red symbols, Cells identified in the clusters shown in B; black symbols, all other cells.
Figure 9.
Figure 9.
Calcium responses in dendrites are twofold larger and faster than in somas. Light flash-evoked fluorescence responses measured in ganglion cells where soma and dendrites were visible in the same focal plane. A, Two-photon images of optically recorded neurons. Measured regions (ROIs) (see Materials and Methods) are shown in blue overlaid on the green fluorescence image. S, Soma; 1–6, dendritic segments. Inset, Fluorescence response for all ROIs (soma, white; dendrites, green). Curves show the fluorescence response after a brief light flash (full-field LED, 458 nm, 125 ms duration, 100 μW/cm2; >10 repeats). Decay time constants (τ) were calculated from a single exponential fit to each curve. Different panels represent different examples. B, C, Comparison of fluorescence response amplitude (B) and decay time constant (C) recorded simultaneously from the dendrites and soma of a ganglion cell (plot includes all data shown in A). D, Time integral of the stimulus evoked fluorescence response recorded in dendrites versus soma (n = 7 cells). B–D, Dotted line, Least-squares linear fit to the data, constrained to pass through the origin. m = fit slope; r values calculated from linear regression.
Figure 10.
Figure 10.
Stimulus-evoked GCaMP3 responses identify distinct functional types. A, B, Two-photon fluorescence image of a GCaMP3-expressing ganglion cell (green) targeted for recording with an extracellular glass electrode (red). C, Simultaneously recorded fluorescence (trace, top) and spike responses (PSTH, bottom) obtained from the cells shown in A (red) and B (black). Cells were stimulated with a full-field light stimulus that switched from dim to bright and vice versa every 2 s. Polarity of the spike response identified the cells as ON and OFF type, respectively. D, Example of a simultaneously recorded, adjacent OFF and ON cell pair (1 and 2, respectively). E, Fluorescence responses (left) of GCaMP3-expressing ganglion cells (right) stimulated with square wave gratings (0.5 cycle mm−1, 1 Hz) drifting in different directions (motion direction orthogonal to grating orientation; response to leftward motion shown). Length of each of the four white bars over each cell in the fluorescence image (right) reflects the Fourier amplitude of the fluorescence response of the cell at 1 Hz for motion in each direction. Direction-selective retinal ganglion cells are indicated by white arrowheads. F, Spatiotemporal tuning functions recorded from a brisk-transient type ganglion cell (data not shown). The cell was stimulated with sine wave gratings of different spatial frequencies and temporal frequencies (70% Michelson contrast; 5 s per trial, 6 repeats) and tuning curves calculated from the simultaneously recorded spike response (left panels) and fluorescence response (right panels).
Figure 11.
Figure 11.
Type AII amacrine cells feature calcium dynamics localized to subcellular compartments that can operate in two apparently distinct response modes. A, Confocal image of a GCaMP3-expressing type AII amacrine cell 14 d after infection with AAV2/1-mGluR1-GCaMP3 (left, radial view). The dotted lines (I–III) indicate approximate focal planes at the level of the soma, proximal dendrites, and distal dendrites shown in the two-photon fluorescence images (right, top-down view). Scale bar, 10 μm. B, Fluorescence response of the four labeled regions shown in A (right panels). Responses were evoked with a brief light flash (full-field LED, 458 nm, 125 ms duration, 100 μW/cm2; magenta lines). Also shown is the response during control trials, when no light flash was presented (black). Laser scanning started at trial onset and ended at the conclusion of each trial (5 s duration). Flash and no-flash trials were presented in a random interleaved order and trials were separated by 500 ms. C, Fluorescence responses recorded from the lobular appendages fell into two nonoverlapping groups based on the time to peak of the light-evoked response (inset). Plot shows flash and no-flash responses for recordings in which the fluorescence response peaked early (dotted lines) and late (solid lines). In all cases, the no-flash response (laser stimulation only) was larger than the flash response, in which laser onset was paired with the full-field LED light flash.

Similar articles

Cited by

References

    1. Barlow HB, Levick WR. The mechanism of directionally selective units in rabbit's retina. J Physiol. 1965;178:477–504. - PMC - PubMed
    1. Barlow HB, Levick WR, Yoon M. Responses to single quanta of light in retinal ganglion cells of the cat. Vision Res. 1971;1971(Suppl 3):87–101. - PubMed
    1. Casagrande VA, Xu X, editors. Parallel visual pathways: a comparative perspective. Cambridge, MA: MIT; 2004.
    1. Chichilnisky EJ. A simple white noise analysis of neuronal light responses. Network. 2001;12:199–213. - PubMed
    1. Demb JB. Cellular mechanisms for direction selectivity in the retina. Neuron. 2007;55:179–186. - PubMed

Publication types

LinkOut - more resources