. 2011 Apr;121(4):1549-60.
doi: 10.1172/JCI44539. Epub 2011 Mar 14.

CD4+ T cells from elite controllers resist HIV-1 infection by selective upregulation of p21

Affiliations

CD4+ T cells from elite controllers resist HIV-1 infection by selective upregulation of p21

Huabiao Chen et al. J Clin Invest. 2011 Apr.

Abstract

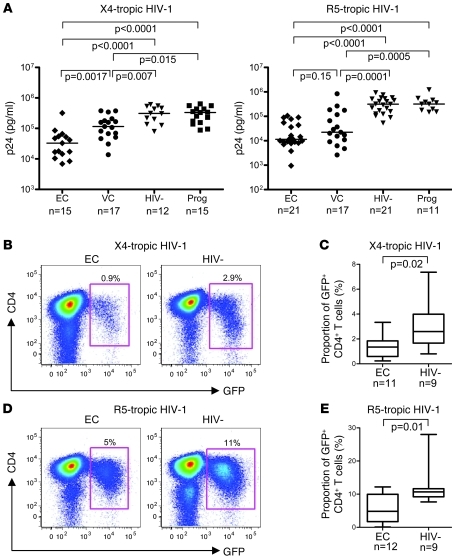
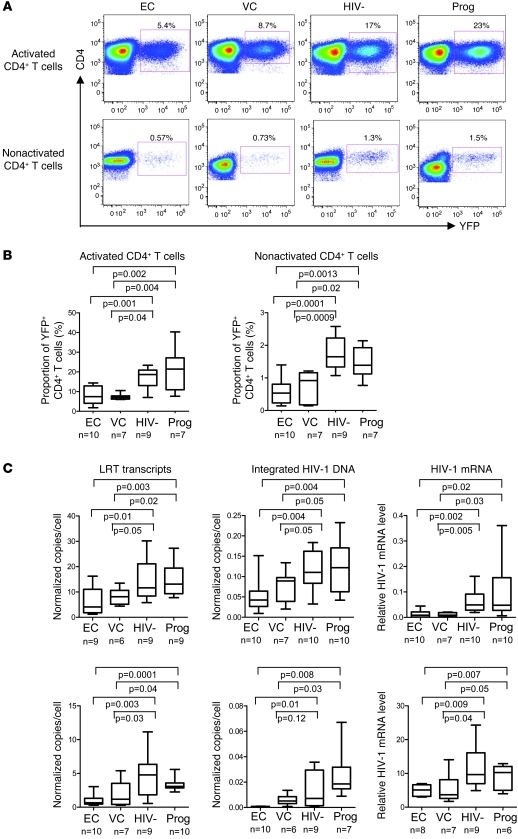
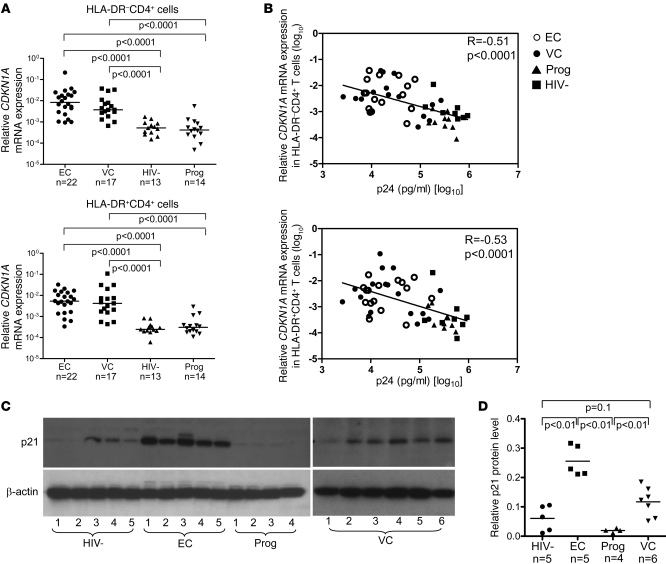
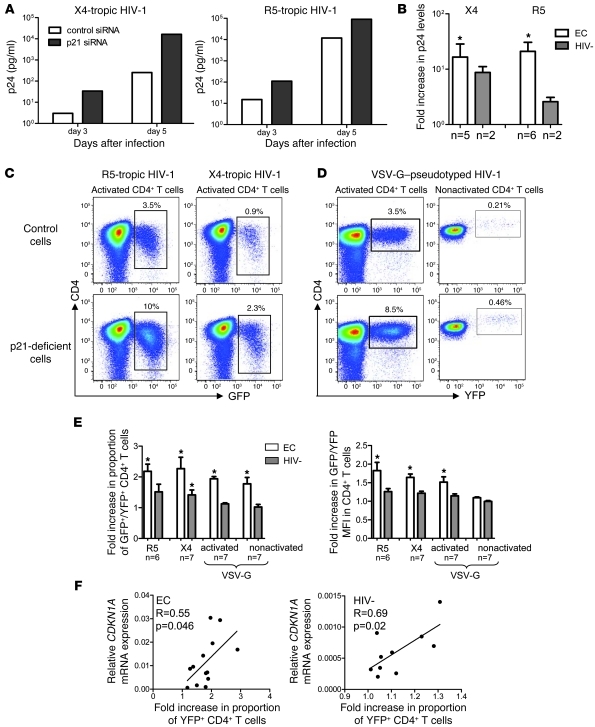
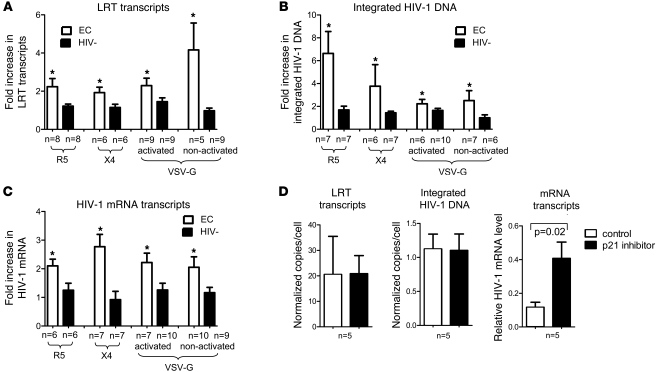
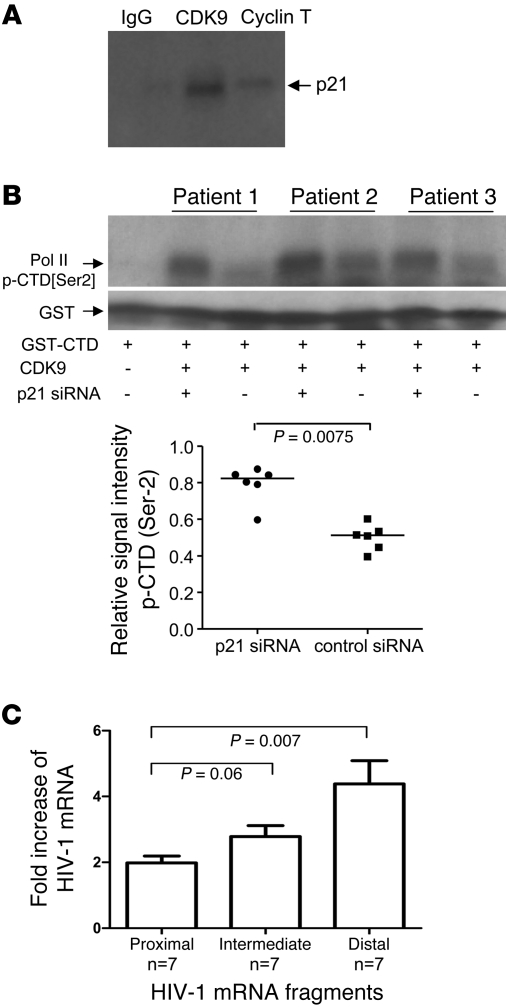
Elite controllers represent a unique group of HIV-1-infected persons with undetectable HIV-1 replication in the absence of antiretroviral therapy. However, the mechanisms contributing to effective viral immune defense in these patients remain unclear. Here, we show that compared with HIV-1 progressors and HIV-1-negative persons, CD4+ T cells from elite controllers are less susceptible to HIV-1 infection. This partial resistance to HIV-1 infection involved less effective reverse transcription and mRNA transcription from proviral DNA and was associated with strong and selective upregulation of the cyclin-dependent kinase inhibitor p21 (also known as cip-1 and waf-1). Experimental blockade of p21 in CD4+ T cells from elite controllers resulted in a marked increase of viral reverse transcripts and mRNA production and led to higher enzymatic activities of cyclin-dependent kinase 9 (CDK9), which serves as a transcriptional coactivator of HIV-1 gene expression. This suggests that p21 acts as a barrier against HIV-1 infection in CD4+ T cells from elite controllers by inhibiting a cyclin-dependent kinase required for effective HIV-1 replication. These data demonstrate a mechanism of host resistance to HIV-1 in elite controllers and may open novel perspectives for clinical strategies to prevent or treat HIV-1 infection.


Figures

Figure 1
Figure 1. Reduced susceptibility of CD4+ T cells from elite controllers to HIV-1 infection.
(A) p24 antigen production in activated CD4+ T cells from elite controllers (EC), viremic controllers (VC), HIV-1–negative persons (HIV-), and HIV-1 progressors (Prog) after exogenous HIV-1 infection with the X4-tropic primary isolate 92HT599 and the primary R5-utilizing strain 91US056. Data were obtained on day 7 after infection; similar patterns of p24 antigen production were observed on days 3 and 5 after infection (Supplemental Figure 1). Baseline p24 levels in autologous cells without exogenous HIV-1 infection were subtracted as background. Significance was tested using Mann-Whitney U test. (BE) Flow cytometric assessment of HIV-1 replication in activated CD4+ T cells from elite controllers and HIV-1–negative persons on day 4 after infection with GFP-encoding X4- and R5-tropic HIV-1 isolates. (B and D) Representative flow cytometry dot plots from 1 elite controller and 1 HIV-1–negative person. Percentages indicate the respective proportions of gated GFP+ CD4+ cells. (C and E) Proportion of GFP+ CD4+ T cells from the indicated subjects. Bounds of boxes denote interquartile range; lines within boxes denote median; whiskers indicate range.
Figure 2
Figure 2. Analysis of early HIV-1 replication steps in CD4+ T cells after infection with a single-cycle YFP-encoding, VSV-G–pseudotyped HIV-1 vector.
(A) Representative flow cyto­metry dot plots reflecting the proportion of YFP+ CD4+ T cells from the indicated cohorts with or without prior ex vivo activation. Percentages indicate the respective proportions of gated YFP+ CD4+ cells. (B) Proportion of YFP+ CD4+ cells in activated and nonactivated CD4+ T cells in the indicated cohorts. (C) Quantitative analysis of LRT transcripts, integrated HIV-1 DNA, and HIV-1 mRNA transcripts in activated or nonactivated CD4+ T cells from the 4 study cohorts. HIV-1 transcript numbers from autologous virus measured in cells without exogenous infection were subtracted as background. Bounds of boxes denote interquartile range; lines within boxes denote median; whiskers indicate range. Statistical comparison was performed using Student’s t tests.
Figure 3
Figure 3. Upregulation of p21 expression in CD4+ T cells from elite controllers.
(A) Relative CDKN1A mRNA expression in sorted HLA-DR and HLA-DR+ CD4+ T cells from the indicated groups. (B) Correlation between relative CDKN1A mRNA expression in HLA-DR and HLA-DR+ CD4+ T cells and susceptibility of CD4+ T cells to HIV-1 infection, as determined by p24 production 7 days after infection of in vitro activated cells with R5-tropic HIV-1. Data from elite controllers, viremic controllers, HIV-1–negative persons, and HIV-1 progressors were included. Pearson’s correlation coefficient is shown. (C) Western blots reflecting p21 and β-actin protein expression in CD4+ T cells from the indicated cohorts. (D) Quantitative p21 protein expression in CD4+ T cells from indicated study patients. (A, B, and D) Statistical comparison was performed using Student’s t tests.
Figure 4
Figure 4. Inhibition of p21 enhances HIV-1 replication in CD4+ T cells.
(A and B) Activated CD4+ T cells from elite controllers or HIV-1–negative persons were infected with X4- or R5-tropic primary HIV-1 isolates in the presence of p21-specific or control siRNA; HIV-1 replication was assessed by p24 antigen levels in culture supernatants. (A) Representative example from an HIV-1 elite controller. (B) Fold increase (mean and SD) of p24 levels in p21-deficient versus control cells in indicated persons. (CF) Flow cytometric assessment of HIV-1 replication in CD4+ T cells after p21 inhibition. CD4+ T cells were infected with GFP-encoding X4- or R5-tropic HIV-1 strains in the presence of p21-siRNA or control siRNA or with a YFP-encoding VSV-G–pseudotyped HIV-1 vector in the presence of a pharmacological p21 inhibitor or the carrier DMSO. (C and D) Representative dot plots from an elite controller. Percentages indicate the proportion of gated CD4+ T cells. (E) Fold increase (mean and SD) in the proportion of GFP+/YFP+ cells or in GFP/YFP mean fluorescence intensity in p21-deficient cells compared with controls. White bar, EC; Grey bar, HIV-1. (F) Correlation between CDKN1A mRNA expression in HLA-DR CD4+ T cells from elite controllers and HIV-1–negative persons and corresponding fold increases of YFP+ cells after p21 inhibition. *P < 0.05; p21-deficient cells versus control cells treated with unspecific siRNA or SMSO; paired Wilcoxon test. Statistical comparison was performed using Student’s t test.
Figure 5
Figure 5. p21 inhibition increases multiple early HIV-1 replication steps.
(AC) Quantitative analysis of HIV-1 LRT transcripts (A), integrated HIV-1 DNA (B), and HIV-1 mRNA transcripts (C) in CD4+ T cells from elite controllers or HIV-1–negative persons after inhibition of p21. Activated CD4+ T cells were infected with X4- or R5-tropic HIV-1 isolates after electroporation with p21-specific or control siRNA. Alternatively, activated or nonactivated CD4+ T cells were infected with a single-cycle VSV-G–pseudotyped HIV-1 vector in the presence of a small molecule inhibitor of p21 or DMSO as control. Data show mean and SD fold increase of respective copy numbers in p21-deficient cells compared with corresponding control cells from the indicated number of subjects. *P < 0.05; p21 deficient cells versus control cells treated with unspecific siRNA or SMSO; paired Wilcoxon test. (D) Effect of p21 inhibition on HIV-1 mRNA transcription from proviral HIV-1 DNA. Ex vivo activated CD4+ T cells from elite controllers were infected with a VSV-G–pseudotyped HIV-1 vector; YFP+ cells were sorted after 36 hours and exposed to p21 inhibitor. Data are mean and SD of LRT transcripts, integrated HIV-1 DNA, and viral mRNA from sorted YFP+ CD4+ T cells 84 hours after infection. Statistical comparison was performed using paired Wilcoxon test.
Figure 6
Figure 6. p21 inhibits enzymatic activity of CDK9 and affects HIV-1 transcriptional elongation.
(A) Whole protein lysates of CD4+ T cells from elite controllers were precipitated with anti-CDK9, anti–cyclin T, or unspecific anti-IgG control antibodies and subsequently interrogated with p21-specific antibodies using Western blotting. Shown is 1 representative experiment of 2. (B) Assessment of the enzymatic activity of CDK9 in CD4+ T cells from elite controllers electroporated with p21-specific or control siRNA. CDK9 isolated from electroporated CD4+ T cells was mixed with a recombinant, GST-tagged protein representing the CTD of human RNA polymerase II serving as a substrate for CDK9. Phosphorylation of CTD polymerase II was detected by phospho-Ser2–specific antibodies in 3 representative patients. Cumulative data from 6 patients per group are also shown. Statistical comparison was performed using paired Wilcoxon test. (C) Influence of p21 on transcription of proximal and distal HIV-1 mRNA transcripts. CD4+ T cells from elite controllers were infected with VSV-G–pseudotyped HIV-1 after treatment with p21 inhibitor or DMSO as control. Data are mean and SD fold increase in expression of proximal, intermediate, and distal HIV-1 mRNA transcripts in p21-deficient relative to control cells. Statistical comparison between expression intensity of different mRNA transcripts was performed using Mann-Whitney U test.

Similar articles

Cited by

References

    1. Saez-Cirion A, et al. HIV controllers–How do they tame the virus? Trends Immunol. 2007;28(12):532–540. doi: 10.1016/j.it.2007.09.002. - DOI - PubMed
    1. Walker BD. Elite control of HIV Infection: implications for vaccines and treatment. Top HIV Med. 2007;15(4):134–136. - PubMed
    1. Migueles SA, et al. Lytic granule loading of CD8+ T cells is required for HIV-infected cell elimination associated with immune control. Immunity. 2008;29(6):1009–1021. doi: 10.1016/j.immuni.2008.10.010. - DOI - PMC - PubMed
    1. Migueles SA, et al. HIV-specific CD8+ T cell proliferation is coupled to perforin expression and is maintained in nonprogressors. Nat Immunol. 2002;3(11):1061–1068. doi: 10.1038/ni845. - DOI - PubMed
    1. Lichterfeld M, et al. Loss of HIV-1-specific CD8+ T cell proliferation after acute HIV-1 infection and restoration by vaccine-induced HIV-1-specific CD4+ T cells. J Exp Med. 2004;200(6):701–712. doi: 10.1084/jem.20041270. - DOI - PMC - PubMed

Publication types

MeSH terms