

Ethnicity, body mass, and genome-wide data
- PMID: 21387985
- PMCID: PMC3155265
- DOI: 10.1080/19485565.2010.524589
Ethnicity, body mass, and genome-wide data
Abstract
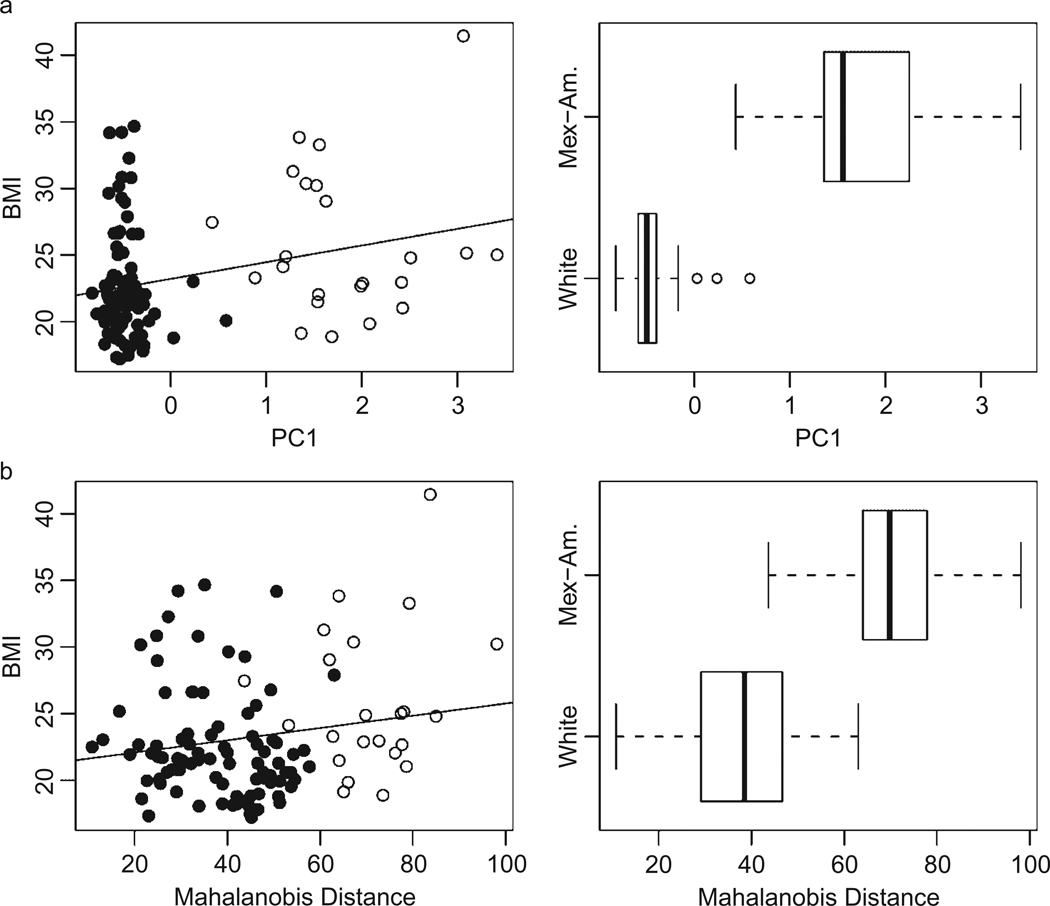
This article combines social and genetic epidemiology to examine the influence of self-reported ethnicity on body mass index (BMI) among a sample of adolescents and young adults. We use genetic information from more than 5,000 single nucleotide polymorphisms in combination with principal components analysis to characterize population ancestry of individuals in this study. We show that non-Hispanic white and Mexican-American respondents differ significantly with respect to BMI and differ on the first principal component from the genetic data. This first component is positively associated with BMI and accounts for roughly 3% of the genetic variance in our sample. However, after controlling for this genetic measure, the observed ethnic differences in BMI remain large and statistically significant. This study demonstrates a parsimonious method to adjust for genetic differences among individual respondents that may contribute to observed differences in outcomes. In this case, adjusting for genetic background has no bearing on the influence of self-identified ethnicity.
Figures
Similar articles
-
A Large Multiethnic Genome-Wide Association Study of Adult Body Mass Index Identifies Novel Loci.Genetics. 2018 Oct;210(2):499-515. doi: 10.1534/genetics.118.301479. Epub 2018 Aug 14. Genetics. 2018. PMID: 30108127 Free PMC article.
-
BMI loci and longitudinal BMI from adolescence to young adulthood in an ethnically diverse cohort.Int J Obes (Lond). 2017 May;41(5):759-768. doi: 10.1038/ijo.2016.233. Epub 2016 Dec 27. Int J Obes (Lond). 2017. PMID: 28025578 Free PMC article.
-
Comparing the Utility of Mitochondrial and Nuclear DNA to Adjust for Genetic Ancestry in Association Studies.Cells. 2019 Apr 3;8(4):306. doi: 10.3390/cells8040306. Cells. 2019. PMID: 30987182 Free PMC article.
-
A genome-wide association study of BMI in American Indians.Obesity (Silver Spring). 2011 Oct;19(10):2102-6. doi: 10.1038/oby.2011.178. Epub 2011 Jun 23. Obesity (Silver Spring). 2011. PMID: 21701565 Free PMC article.
-
Screening and Interventions for Childhood Overweight [Internet].Rockville (MD): Agency for Healthcare Research and Quality (US); 2005 Jul. Rockville (MD): Agency for Healthcare Research and Quality (US); 2005 Jul. PMID: 20722132 Free Books & Documents. Review.
Cited by
-
Ancestry: How researchers use it and what they mean by it.Front Genet. 2023 Jan 23;14:1044555. doi: 10.3389/fgene.2023.1044555. eCollection 2023. Front Genet. 2023. PMID: 36755575 Free PMC article.
-
The contribution of FTO and UCP-1 SNPs to extreme obesity, diabetes and cardiovascular risk in Brazilian individuals.BMC Med Genet. 2012 Nov 7;13:101. doi: 10.1186/1471-2350-13-101. BMC Med Genet. 2012. PMID: 23134754 Free PMC article.
References
-
- Allan JD, Mayo K, Michel Y. Body size values of white and black women. Res Nurs Health. 1993;16:323–333. - PubMed
-
- Andreasen Camilla H, Stender-Petersen Kirstine L, Mogensen Mette S, Torekov Signe S, Wegner Lise, Andersen Gitte, Nielsen Arne L, Albrechtsen Anders, Borch-Johnsen Knut, Rasmussen Signe S, et al. Low physical activity accentuates the effect of the FTO Rs9939609 polymorphism on body fat accumulation. Diabetes. 2008;57:95–101. - PubMed
-
- Andrieu E, Darmon N, Drewnowski A. Low-cost diets: more energy, fewer nutrients. Eur J Clin Nutr. 2006;60:434–436. - PubMed
-
- Ball K, Timperio A, Crawford D. Neighbourhood socioeconomic inequalities in food access and affordability. Health Place. 2009;15:578–585. - PubMed
-
- Banks James, Marmot Michael, Oldfield Zoe, Smith James P. Disease and disadvantage in the United States and in England. JAMA. 2006;295:2037–2045. - PubMed
Publication types
MeSH terms
Grants and funding
LinkOut - more resources
Full Text Sources
Medical