Exercise ameliorates high-fat diet-induced metabolic and vascular dysfunction, and increases adipocyte progenitor cell population in brown adipose tissue
- PMID: 21368268
- PMCID: PMC3094041
- DOI: 10.1152/ajpregu.00806.2010
Exercise ameliorates high-fat diet-induced metabolic and vascular dysfunction, and increases adipocyte progenitor cell population in brown adipose tissue
Abstract
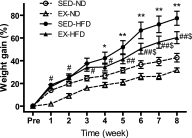
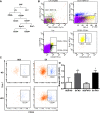
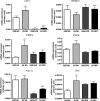
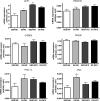
A high-fat diet (HFD) is associated with adipose inflammation, which contributes to key components of metabolic syndrome, including obesity and insulin resistance. The increased visceral adipose tissue mass associated with obesity is the result of hyperplasia and hypertrophy of adipocytes. To investigate the effects of exercise on HFD-induced metabolic disorders, male C57BL/6 mice were divided into four groups: SED (sedentary)-ND (normal diet), EX (exercise)-ND, SED-HFD, and EX-HFD. Exercise was performed on a motorized treadmill at 15 m/min, 40 min/day, and 5 day/wk for 8 wk. Exercise resulted in a decrease in abdominal fat contents and inflammation, improvements in glucose tolerance and insulin resistance, and enhancement of vascular constriction and relaxation responses. Exercise with or without HFD increased putative brown adipocyte progenitor cells in brown adipose tissue compared with groups with the same diet, with an increase in brown adipocyte-specific gene expression in brown and white adipose tissue. Exercise training enhanced in vitro differentiation of the preadipocytes from brown adipose depots into brown adipocytes and enhanced the expression of uncoupling protein 1. These findings suggest that exercise ameliorates high-fat diet-induced metabolic disorders and vascular dysfunction, and increases adipose progenitor cell population in brown adipose tissue, which might thereby contribute to enhanced functional brown adipose.
Figures


Similar articles
-
Comparative studies on the effects of high-fat diet, endurance training and obesity on Ucp1 expression in male C57BL/6 mice.Gene. 2018 Nov 15;676:16-21. doi: 10.1016/j.gene.2018.07.015. Epub 2018 Jul 6. Gene. 2018. PMID: 30201103
-
Adipocyte-specific Hypoxia-inducible gene 2 promotes fat deposition and diet-induced insulin resistance.Mol Metab. 2016 Sep 28;5(12):1149-1161. doi: 10.1016/j.molmet.2016.09.009. eCollection 2016 Dec. Mol Metab. 2016. PMID: 27900258 Free PMC article.
-
Altered adipocyte progenitor population and adipose-related gene profile in adipose tissue by long-term high-fat diet in mice.Life Sci. 2012 Jun 27;90(25-26):1001-9. doi: 10.1016/j.lfs.2012.05.016. Epub 2012 Jun 5. Life Sci. 2012. PMID: 22683431 Free PMC article.
-
Age-Induced Changes in White, Brite, and Brown Adipose Depots: A Mini-Review.Gerontology. 2018;64(3):229-236. doi: 10.1159/000485183. Epub 2017 Dec 7. Gerontology. 2018. PMID: 29212073 Review.
-
Genetic variation in brown fat activity and body weight regulation in mice: lessons for human studies.Biochim Biophys Acta. 2014 Mar;1842(3):370-6. doi: 10.1016/j.bbadis.2013.04.025. Epub 2013 May 2. Biochim Biophys Acta. 2014. PMID: 23644163 Review.
Cited by
-
Irisin ERKs the fat.Diabetes. 2014 Feb;63(2):381-3. doi: 10.2337/db13-1586. Diabetes. 2014. PMID: 24464712 Free PMC article. No abstract available.
-
Cold and Exercise: Therapeutic Tools to Activate Brown Adipose Tissue and Combat Obesity.Biology (Basel). 2019 Feb 12;8(1):9. doi: 10.3390/biology8010009. Biology (Basel). 2019. PMID: 30759802 Free PMC article. Review.
-
Can Resistance Exercise Alter Irisin Levels and Expression Profiles of FNDC5 and UCP1 in Rats?Asian J Sports Med. 2016 Oct 16;7(4):e35205. doi: 10.5812/asjsm.35205. eCollection 2016 Dec. Asian J Sports Med. 2016. PMID: 28144410 Free PMC article.
-
Brown and beige fat in humans: thermogenic adipocytes that control energy and glucose homeostasis.J Clin Invest. 2015 Feb;125(2):478-86. doi: 10.1172/JCI78362. Epub 2015 Feb 2. J Clin Invest. 2015. PMID: 25642708 Free PMC article. Review.
-
Effect of co-exposure to nickel and particulate matter on insulin resistance and mitochondrial dysfunction in a mouse model.Part Fibre Toxicol. 2012 Nov 5;9:40. doi: 10.1186/1743-8977-9-40. Part Fibre Toxicol. 2012. PMID: 23126276 Free PMC article.
References
-
- Anderson SE, Whitaker RC. Prevalence of obesity among U.S. preschool children in different racial and ethnic groups. Arch Pediatr Adolesc Med 163: 344–348, 2009. - PubMed
-
- Bruun JM, Helge JW, Richelsen B, Stallknecht B. Diet and exercise reduce low-grade inflammation and macrophage infiltration in adipose tissue but not in skeletal muscle in severely obese subjects. Am J Physiol Endocrinol Metab 290: E961–E967, 2006. - PubMed
-
- Champigny O, Ricquier D. Evidence from in vitro differentiating cells that adrenoceptor agonists can increase uncoupling protein mRNA level in adipocytes of adult humans: an RT-PCR study. J Lipid Res 37: 1907–1914, 1996. - PubMed
-
- Cook S, Weitzman M, Auinger P, Nguyen M, Dietz WH. Prevalence of a metabolic syndrome phenotype in adolescents: findings from the third National Health and Nutrition Examination Survey, 1988–1994. Arch Pediatr Adolesc Med 157: 821–827, 2003. - PubMed
Publication types
MeSH terms
Substances
Grants and funding
LinkOut - more resources
Full Text Sources
Other Literature Sources
Medical
Research Materials

