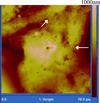
Quantitative analysis of human keratinocyte cell elasticity using atomic force microscopy (AFM)
- PMID: 21349797
- PMCID: PMC3852989
- DOI: 10.1109/TNB.2011.2113397
Quantitative analysis of human keratinocyte cell elasticity using atomic force microscopy (AFM)
Abstract
We present the use of atomic force microscopy (AFM) to visualize and quantify the dynamics of epithelial cell junction interactions under physiological and pathophysiological conditions at the nanoscale. Desmosomal junctions are critical cellular adhesion components within epithelial tissues and blistering skin diseases such as Pemphigus are the result in the disruption of these components. However, these structures are complex and mechanically inhomogeneous, making them difficult to study. The mechanisms of autoantibody mediated keratinocyte disassembly remain largely unknown. Here, we have used AFM technology to image and measure the mechanical properties of living skin epithelial cells in culture. We demonstrate that force measurement data can distinguish cells cultured with and without autoantibody treatment. Our demonstration of the use of AFM for in situ imaging and elasticity measurements at the local, or tissue level opens potential new avenues for the investigation of disease mechanisms and monitoring of therapeutic strategies in blistering skin diseases.
Figures


Similar articles
-
Investigation of human keratinocyte cell adhesion using atomic force microscopy.Nanomedicine. 2010 Feb;6(1):191-200. doi: 10.1016/j.nano.2009.05.008. Epub 2009 Jul 17. Nanomedicine. 2010. PMID: 19616642
-
Atomic force microscopy identifies regions of distinct desmoglein 3 adhesive properties on living keratinocytes.Nanomedicine. 2015 Apr;11(3):511-20. doi: 10.1016/j.nano.2014.10.006. Epub 2014 Dec 12. Nanomedicine. 2015. PMID: 25510735
-
Atomic Force Microscopy Provides New Mechanistic Insights into the Pathogenesis of Pemphigus.Front Immunol. 2018 Mar 28;9:485. doi: 10.3389/fimmu.2018.00485. eCollection 2018. Front Immunol. 2018. PMID: 29643851 Free PMC article. Review.
-
Cellular biomechanics impairment in keratinocytes is associated with a C-terminal truncated desmoplakin: An atomic force microscopy investigation.Micron. 2018 Mar;106:27-33. doi: 10.1016/j.micron.2017.12.005. Epub 2017 Dec 19. Micron. 2018. PMID: 29291530
-
Mechanisms of desmosome assembly and disassembly.Clin Exp Dermatol. 2002 Nov;27(8):684-90. doi: 10.1046/j.1365-2230.2002.01116.x. Clin Exp Dermatol. 2002. PMID: 12472547 Review.
Cited by
-
Qualitative analysis of contribution of intracellular skeletal changes to cellular elasticity.Cell Mol Life Sci. 2020 Apr;77(7):1345-1355. doi: 10.1007/s00018-019-03328-6. Epub 2019 Oct 11. Cell Mol Life Sci. 2020. PMID: 31605149 Free PMC article. Review.
-
Cellular level robotic surgery: Nanodissection of intermediate filaments in live keratinocytes.Nanomedicine. 2015 Jan;11(1):137-45. doi: 10.1016/j.nano.2014.08.008. Epub 2014 Sep 6. Nanomedicine. 2015. PMID: 25200612 Free PMC article.
-
Cellular biophysical dynamics and ion channel activities detected by AFM-based nanorobotic manipulator in insulinoma β-cells.Nanomedicine. 2013 Jul;9(5):636-45. doi: 10.1016/j.nano.2012.10.011. Epub 2012 Nov 22. Nanomedicine. 2013. PMID: 23178285 Free PMC article.
-
Patterning of human epidermal stem cells on undulating elastomer substrates reflects differences in cell stiffness.Acta Biomater. 2019 Mar 15;87:256-264. doi: 10.1016/j.actbio.2019.01.063. Epub 2019 Jan 30. Acta Biomater. 2019. PMID: 30710711 Free PMC article.
-
A designer cell culture insert with a nanofibrous membrane toward engineering an epithelial tissue model validated by cellular nanomechanics.Nanoscale Adv. 2021 Jul 5;3(16):4714-4725. doi: 10.1039/d1na00280e. eCollection 2021 Aug 10. Nanoscale Adv. 2021. PMID: 36134314 Free PMC article.
References
-
- Engel A, Müller DJ. Observing single biomolecules at work with the atomic force microscope. Nature Structural Biology. 2000;vol. 7(no. 9):715–718. - PubMed
-
- Hörber JKH, Miles MJ. Scanning probe evolution in biology. Science. 2003;vol. 302:1002–1005. - PubMed
-
- Dufrêne YF. Using nanotechniques to explore microbial surfaces. Nature Reviews Microbiology. 2004;vol. 2:451–460. - PubMed
-
- Cross SE, Jin Y, Rao J, Gimzewski JK. Nanomechanical analysis of cells from cancer patients. Nat. Nanotechnology. 2007;vol. 2:780–783. - PubMed
-
- Suresh S. Nanomedicine: elastic clues in cancer detection. Nat. Nanotechnology. 2007;vol. 2:748–749. - PubMed
Publication types
MeSH terms
Substances
Grants and funding
LinkOut - more resources
Full Text Sources
Miscellaneous

