. 2011 Mar;135(3):263-80.
doi: 10.1007/s00418-011-0793-3. Epub 2011 Feb 24.

Premature chromosome condensation induced by caffeine, 2-aminopurine, staurosporine and sodium metavanadate in S-phase arrested HeLa cells is associated with a decrease in Chk1 phosphorylation, formation of phospho-H2AX and minor cytoskeletal rearrangements

Affiliations

Premature chromosome condensation induced by caffeine, 2-aminopurine, staurosporine and sodium metavanadate in S-phase arrested HeLa cells is associated with a decrease in Chk1 phosphorylation, formation of phospho-H2AX and minor cytoskeletal rearrangements

Dorota Rybaczek et al. Histochem Cell Biol. 2011 Mar.

Abstract

Here, we demonstrate that in HeLa cells, Ser317 of Chk1 undergoes phosphorylation in response to replication stress induced by hydroxyurea. We also demonstrate the existence of constitutive (interphase and mitotic) Chk1 kinase phosphorylation, the translocation of its phosphorylated form from the nucleus to cytoplasm in prometaphase as well as strong labeling of apoptotic nuclei with α-Chk1(S317) antibodies. Additionally, we show that caffeine, 2-aminopurine, staurosporine and sodium metavanadate can induce premature chromosome condensation (PCC) by the abrogation of the S-M checkpoint. Staurosporine appeared to be the most effective PCC inductor, and as in the case of the remaining inductors, the addition of hydroxyurea each time brought about an increase in the number of cells showing PCC symptoms (synergic effect). The forced premature mitosis was accompanied by an increasing index of double-strand breaks marked by the phosphorylation of histone H2AX on Ser139. Moreover, we found that the chemicals used brought about minor actin and tubulin network rearrangements that occurred following either replication stress or drug-induced cell cycle delay. At the same time, it was found that the extent of the cytoskeleton rearrangement did not hinder PCC in all its subperiods, i.e., from PCC-type prophase to PCC-type telophase.


Figures
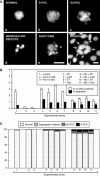
Fig. 1
Fig. 1
A Normal mitotic HeLa cell (a). The major categories of PCC phenotype: S-PCC (b), G2-PCC (c), and chromosome segregation defects (d). Representative nucleus displaying signs of apoptosis (e). HeLa cells treated with hydroxyurea were stained with DAPI dye for DNA. Micronucleus formation (f; arrows), were found significantly increased in comparison with the control. Scale bars = 10 μm. (B) Mitotic indices (%) and % of cell nuclei displaying signs of apoptosis evaluated for HeLa cells (the cells were treated as described in the figure legend). (C) Quantification of PCC phenotypes in HeLa cells
Fig. 2
Fig. 2
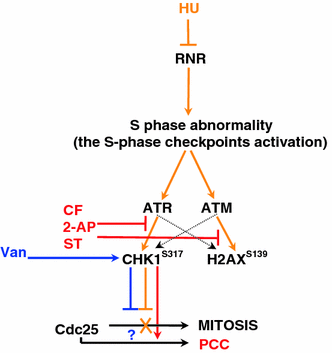
A model for the hydroxyurea-induced checkpoint signaling and modulation by caffeine, 2-aminopurine, staurosporine and sodium metavanadate. The mechanisms connected with the S-phase checkpoints are set in motion under the conditions of replication stress [under the influence of hydroxyurea (HU), an inhibitor of ribonucleotide reductase (RNR)], which results in the phosphorylation of Chk1 kinase by superior kinases: ATM and ATR. The activated Chk1 can inactivate Cdc25C phosphatase by phosphorylation on Ser216, which results in the inhibition of Cdc2 activation and G2/M passages (orange pathway). Caffeine (CF), 2-aminopurine (2-AP), staurosporine (ST) and sodium metavanadate (Van) induce the premature condensation of chromosomes (PCC), most probably by omitting the mechanism that blocks Cdc25 phosphatase and Cdk1/cyclin B complex (red and blue pathways)
Fig. 3
Fig. 3
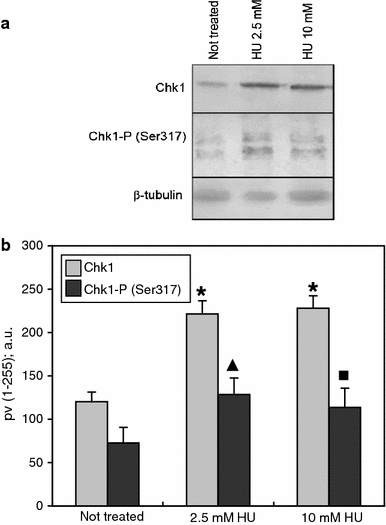
Expression levels of the total and phosphorylated Chk1 protein kinase at Ser317 by Western blot analysis (a). Data shown are representative of three independent experiments. The relative levels of Chk1 (total) and Chk1-P (Ser317) after normalization for β-tubulin, as determined by densitometry analysis of the bands, are shown in the histogram (b; the pixel values [pv; 1–255] categorized according to densitometry analysis of the bands intensities and expressed in arbitrary units [a.u.]). Columns, mean from three independent experiments; bars, SD. * P < 0.001, compared with control (Mann–Whitney U test; U = 0); filled diamond, P < 0.001, compared with control (Mann–Whitney U test; U = 18.5); filled square, P < 0.001, compared control (Mann–Whitney U test; U = 71.5)
Fig. 4
Fig. 4
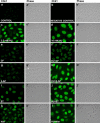
Micrographic pictures showing the intranuclear localization of phospho-Chk1S317 in HeLa cells; control (aa′), a negative control section incubated with secondary antibodies only (bb′), cells incubated for 24 h with 2.5 mM hydroxyurea (cc′), cells incubated for 24 h with 10 mM hydroxyurea (dd′), cells incubated for 24 h with 2.5 mM hydroxyurea and post-treated with 5 mM caffeine (ee′), cells incubated for 24 h with 2.5 mM hydroxyurea and post-treated with the mixture of 2.5 mM hydroxyurea and 5 mM caffeine (ff′), cells incubated for 24 h with 2.5 mM hydroxyurea and post-treated with 10 mM 2-aminopurine (gg′), cells incubated for 24 h with 2.5 mM hydroxyurea and post-treated with the mixture of 2.5 mM hydroxyurea and 10 mM 2-aminopurine (hh′), cells incubated for 24 h with 2.5 mM hydroxyurea and post-treated with 200 nM staurosporine (ii′), cells incubated for 24 h with 2.5 mM hydroxyurea and post-treated with the mixture of 2.5 mM hydroxyurea and 200 nM staurosporine (jj′), cells incubated for 24 h with 2.5 mM hydroxyurea and post-treated with 200 μM sodium metavanadate (kk′), cells incubated for 24 h with 2.5 mM hydroxyurea and post-treated with the mixture of 2.5 mM hydroxyurea and 200 μM sodium metavanadate (ll′). Scale bar = 10 μm
Fig. 5
Fig. 5
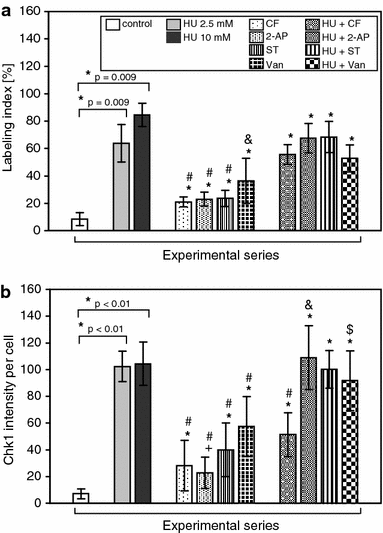
a Immunolabeling indices (%) estimated for HeLa cells stained with anti-Chk1S317 antibodies. Columns, mean from five independent experiments; bars, SD. * P = 0.009, compared with control (Mann–Whitney tests); # P = 0.009, compared with 2.5 mM HU (Mann–Whitney tests); & P = 0.03, compared with 2.5 mM HU (Mann–Whitney tests). b Quantification of anti-Chk1S317 pixel intensity per cell. Columns, mean from at least 108 cells per sample taken from five independent experiments; bars, SD. * P < 0.01, compared with control (Mann–Whitney tests); + P < 0.001, compared with control (Mann–Whitney tests); # P < 0.01 compared with 2.5 mM HU (Mann–Whitney tests); & P = 0.000215, compared with 2.5 mM HU (Mann–Whitney tests); $ P = 0.000038 compared with 2.5 mM HU (Mann–Whitney tests)
Fig. 6
Fig. 6
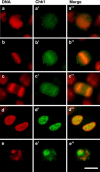
The mitotic, post-mitotic and apoptotic Chk1S317 phosphorylation patterns in HeLa cells after caffeine-induced PCC. Prophase (aa′′), metaphase (bb′′), anaphase (cc′′), post-telophase (dd′′), apoptosis (ee′′). Scale bar = 10 μm
Fig. 7
Fig. 7
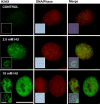
Micrographic pictures showing the intranuclear localization of phospho-H2AXS139 in HeLa cells. Scale bar = 10 μm
Fig. 8
Fig. 8
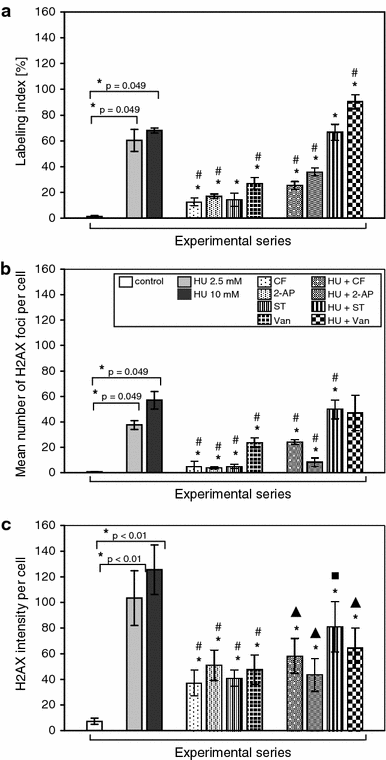
a Immunolabeling indices (%) estimated for HeLa cells stained with anti-H2AXS139 antibodies. Columns, mean from three independent experiments; bars, SD. * P = 0.049, compared with control (Mann–Whitney tests); # P = 0.049, compared with 2.5 mM HU (Mann–Whitney tests). b Mean number of intranuclear phospho-H2AX foci generated in HeLa cells. Columns, mean from at least 300 cells per sample taken from three independent experiments; bars, SD. * P = 0.049, compared with control (Mann–Whitney tests); # P = 0.049, compared with 2.5 mM HU (Mann–Whitney tests). c Quantification of anti-H2AXS139 pixel intensity per cell. Columns, mean from at least 106 cells per sample taken from three independent experiments; bars, SD. * P < 0.01, compared with control (Mann–Whitney tests); # P < 0.01, compared with 2.5 mM HU (Mann–Whitney tests); filled diamond, P < 0.01, compared with 2.5 mM HU (t tests with Cochran-Cox correction); filled square, P < 0.001 compared with 2.5 mM HU (t tests on log-transformed values, which were normally distributed)
Fig. 9
Fig. 9
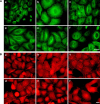
A Organization of the cellular microtubule network in HeLa cells; control (a), cells incubated for 24 h with 2.5 mM hydroxyurea or with 10 mM hydroxyurea (b), cells incubated for 24 h with 2.5 mM hydroxyurea and post-treated either with 5 mM caffeine or with the mixture of 2.5 mM hydroxyurea and 5 mM caffeine (c), cells incubated for 24 h with 2.5 mM hydroxyurea and post-treated either with 10 mM 2-aminopurine or with the mixture of 2.5 mM hydroxyurea and 10 mM 2-aminopurine (d), cells incubated for 24 h with 2.5 mM hydroxyurea and post-treated either with 200 nM staurosporine or with the mixture of 2.5 mM hydroxyurea and 200 nM staurosporine (e), cells incubated for 24 h with 2.5 mM hydroxyurea and post-treated either with 200 μM sodium metavanadate or with the mixture of 2.5 mM hydroxyurea and 200 μM sodium metavanadate (f). Scale bar = 10 μm. B Actin rearrangements occurred in HeLa cells during hydroxyurea-induced arrest and following PCC induction; control (a), cells incubated for 24 h with 2.5 mM hydroxyurea or with 10 mM hydroxyurea (b), cells incubated for 24 h with 2.5 mM hydroxyurea and post-treated either with 5 mM caffeine or with the mixture of 2.5 mM hydroxyurea and 5 mM caffeine (c), cells incubated for 24 h with 2.5 mM hydroxyurea and post-treated either with 10 mM 2-aminopurine or with the mixture of 2.5 mM hydroxyurea and 10 mM 2-aminopurine (d), cells incubated for 24 h with 2.5 mM hydroxyurea and post-treated either with 200 nM staurosporine or with the mixture of 2.5 mM hydroxyurea and 200 nM staurosporine (e), cells incubated for 24 h with 2.5 mM hydroxyurea and post-treated either with 200 μM sodium metavanadate or with the mixture of 2.5 mM hydroxyurea and 200 μM sodium metavanadate (f). Scale bar = 10 μm

Similar articles

Cited by

References

    1. Ajiro K, Yasuda H, Tsuji H. Vanadate triggers the transition from chromosome condensation to decondensation in a mitotic mutant (tsTM13) inactivation of p34cdc2/H1 kinase and dephosphorylation of mitosis-specific histone H3. Eur J Biochem. 1996;241:923–930. doi: 10.1111/j.1432-1033.1996.00923.x. - DOI - PubMed
    1. Alvino GM, Collingwood D, Murphy JM, Delrow J, Brewer BJ, Raghuraman MK. Replication in hydroxyurea: it’s a matter of time. Mol Cell Biol. 2007;27:6396–6406. doi: 10.1128/MCB.00719-07. - DOI - PMC - PubMed
    1. Amiri A, Noei F, Feroz T, Lee JM. Geldanamycin anisimycins activate Rho and stimulate Rho- and ROCK-dependent actin stress fiber formation. Mol Cancer Res. 2007;5:933–942. doi: 10.1158/1541-7786.MCR-06-0362. - DOI - PubMed
    1. An J, Huang YC, Xu QZ, Zhou LJ, Shang ZF, Huang B, Wang Y, Liu XD, Wu DC, Zhou PK (2010) DNA-PKcs plays a dominant role in the regulation of H2AX phosphorylation in response to DNA damage and cell cycle progression. BMC Mol Biol. doi:10.1186/1471-2199-11-18 - PMC - PubMed
    1. Andreassen PR, Margolis RL. Induction of partial mitosis in BHK cells by 2-aminopurine. J Cell Sci. 1991;100:290–310. - PubMed

Publication types

LinkOut - more resources