

Development of a new version of the Liverpool Malaria Model. I. Refining the parameter settings and mathematical formulation of basic processes based on a literature review
- PMID: 21314922
- PMCID: PMC3055220
- DOI: 10.1186/1475-2875-10-35
Development of a new version of the Liverpool Malaria Model. I. Refining the parameter settings and mathematical formulation of basic processes based on a literature review
Abstract
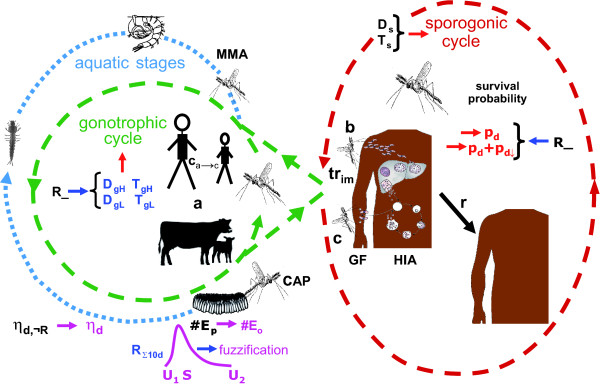
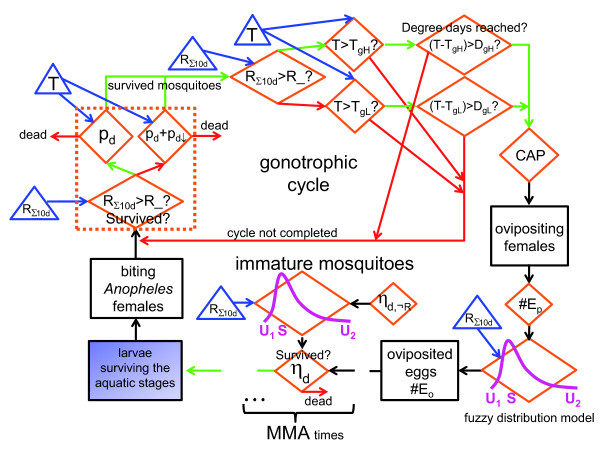
Background: A warm and humid climate triggers several water-associated diseases such as malaria. Climate- or weather-driven malaria models, therefore, allow for a better understanding of malaria transmission dynamics. The Liverpool Malaria Model (LMM) is a mathematical-biological model of malaria parasite dynamics using daily temperature and precipitation data. In this study, the parameter settings of the LMM are refined and a new mathematical formulation of key processes related to the growth and size of the vector population are developed.
Methods: One of the most comprehensive studies to date in terms of gathering entomological and parasitological information from the literature was undertaken for the development of a new version of an existing malaria model. The knowledge was needed to allow the justification of new settings of various model parameters and motivated changes of the mathematical formulation of the LMM.
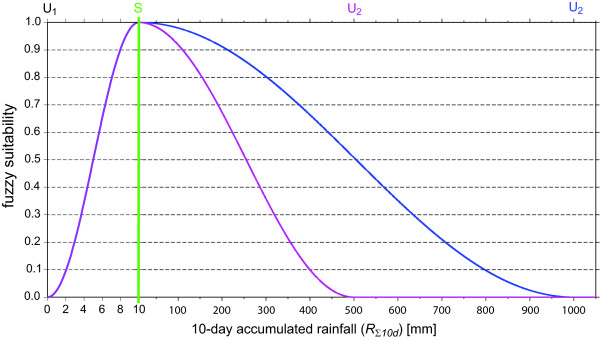
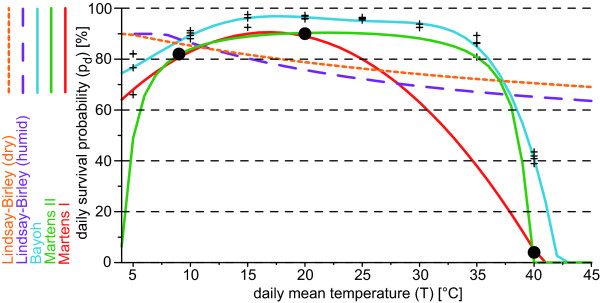
Results: The first part of the present study developed an improved set of parameter settings and mathematical formulation of the LMM. Important modules of the original LMM version were enhanced in order to achieve a higher biological and physical accuracy. The oviposition as well as the survival of immature mosquitoes were adjusted to field conditions via the application of a fuzzy distribution model. Key model parameters, including the mature age of mosquitoes, the survival probability of adult mosquitoes, the human blood index, the mosquito-to-human (human-to-mosquito) transmission efficiency, the human infectious age, the recovery rate, as well as the gametocyte prevalence, were reassessed by means of entomological and parasitological observations. This paper also revealed that various malaria variables lack information from field studies to be set properly in a malaria modelling approach.
Conclusions: Due to the multitude of model parameters and the uncertainty involved in the setting of parameters, an extensive literature survey was carried out, in order to produce a refined set of settings of various model parameters. This approach limits the degrees of freedom of the parameter space of the model, simplifying the final calibration of undetermined parameters (see the second part of this study). In addition, new mathematical formulations of important processes have improved the model in terms of the growth of the vector population.
Figures
Similar articles
-
Development of a new version of the Liverpool Malaria Model. II. Calibration and validation for West Africa.Malar J. 2011 Mar 16;10:62. doi: 10.1186/1475-2875-10-62. Malar J. 2011. PMID: 21410939 Free PMC article.
-
A simulation model of African Anopheles ecology and population dynamics for the analysis of malaria transmission.Malar J. 2004 Jul 30;3:29. doi: 10.1186/1475-2875-3-29. Malar J. 2004. PMID: 15285781 Free PMC article.
-
A weather-driven model of malaria transmission.Malar J. 2004 Sep 6;3:32. doi: 10.1186/1475-2875-3-32. Malar J. 2004. PMID: 15350206 Free PMC article.
-
Statics and dynamics of malaria infection in Anopheles mosquitoes.Malar J. 2004 Jun 4;3:13. doi: 10.1186/1475-2875-3-13. Malar J. 2004. PMID: 15180900 Free PMC article. Review.
-
An evolutionary view of the interactions between anopheline mosquitoes and malaria parasites.Microbes Infect. 1999 Apr;1(4):303-8. doi: 10.1016/s1286-4579(99)80026-4. Microbes Infect. 1999. PMID: 10602664 Review.
Cited by
-
Estimating air temperature and its influence on malaria transmission across Africa.PLoS One. 2013;8(2):e56487. doi: 10.1371/journal.pone.0056487. Epub 2013 Feb 20. PLoS One. 2013. PMID: 23437143 Free PMC article.
-
Uncertainty in malaria simulations in the highlands of Kenya: Relative contributions of model parameter setting, driving climate and initial condition errors.PLoS One. 2018 Sep 26;13(9):e0200638. doi: 10.1371/journal.pone.0200638. eCollection 2018. PLoS One. 2018. PMID: 30256799 Free PMC article.
-
Modelling the impact of vector control interventions on Anopheles gambiae population dynamics.Parasit Vectors. 2011 Jul 28;4:153. doi: 10.1186/1756-3305-4-153. Parasit Vectors. 2011. PMID: 21798055 Free PMC article.
-
Development of a new version of the Liverpool Malaria Model. II. Calibration and validation for West Africa.Malar J. 2011 Mar 16;10:62. doi: 10.1186/1475-2875-10-62. Malar J. 2011. PMID: 21410939 Free PMC article.
-
Climate influences on the cost-effectiveness of vector-based interventions against malaria in elimination scenarios.Philos Trans R Soc Lond B Biol Sci. 2015 Apr 5;370(1665):20130557. doi: 10.1098/rstb.2013.0557. Philos Trans R Soc Lond B Biol Sci. 2015. PMID: 25688017 Free PMC article.
References
-
- Martens WJM, Jetten TH, Focks DA. Sensitivity of malaria, schistomiasis and dengue to global warming. Clim Change. 1997;35:145–156. doi: 10.1023/A:1005365413932. - DOI
-
- Patz JA, Strzepec K, Lele S, Hedden M, Green S, Noden B, Hay SI, Kalkstein L, Beier JC. Predicting key malaria transmission factors, biting and entomological inoculation rates, using modelled soil moisture in Kenja. Trop Med Int Health. 1998;3:818–827. doi: 10.1046/j.1365-3156.1998.00309.x. - DOI - PubMed
-
- Ross R. The prevention of malaria. 2. London, United Kingdom: John Murray; 1911.
Publication types
MeSH terms
LinkOut - more resources
Full Text Sources
Medical
