. 2011 Feb 2;31(5):1919-33.
doi: 10.1523/JNEUROSCI.5128-10.2011.

Subregional specification of embryonic stem cell-derived ventral telencephalic tissues by timed and combinatory treatment with extrinsic signals

Affiliations

Subregional specification of embryonic stem cell-derived ventral telencephalic tissues by timed and combinatory treatment with extrinsic signals

Teruko Danjo et al. J Neurosci. .

Abstract

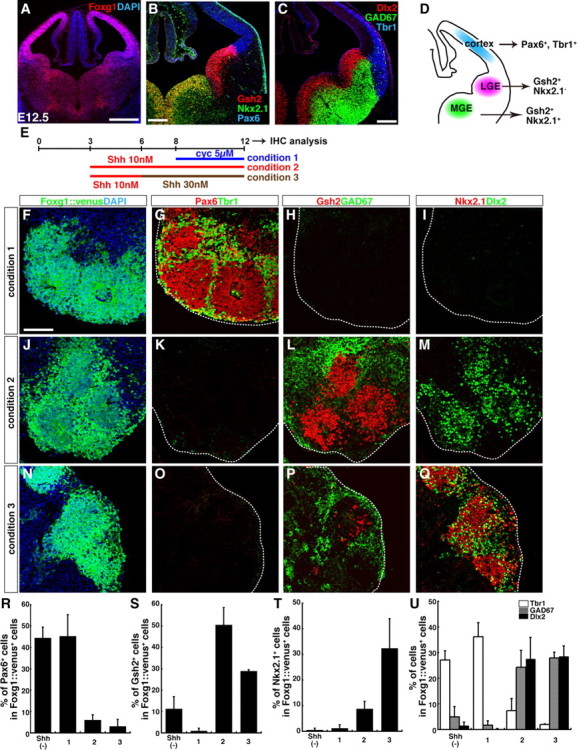
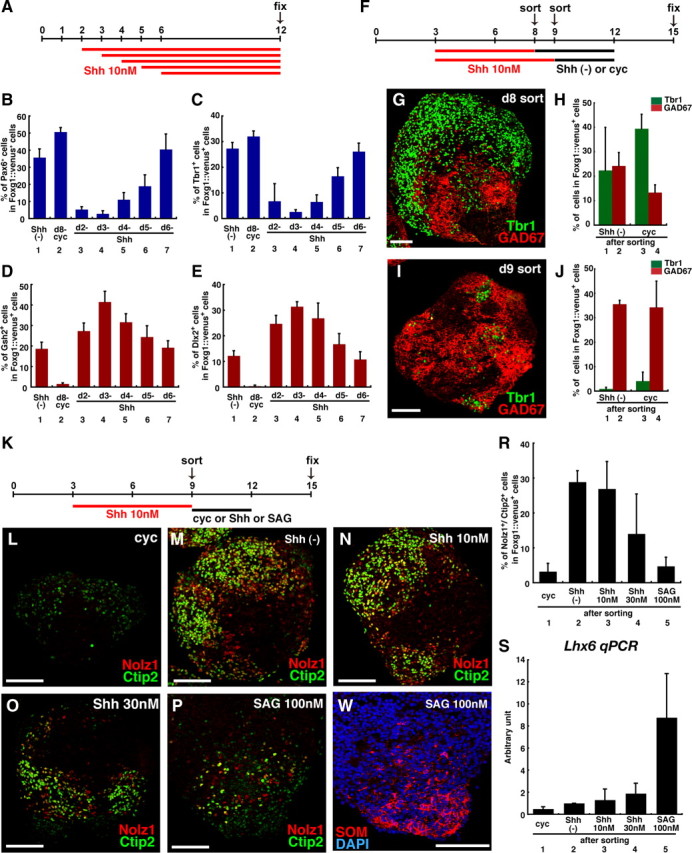
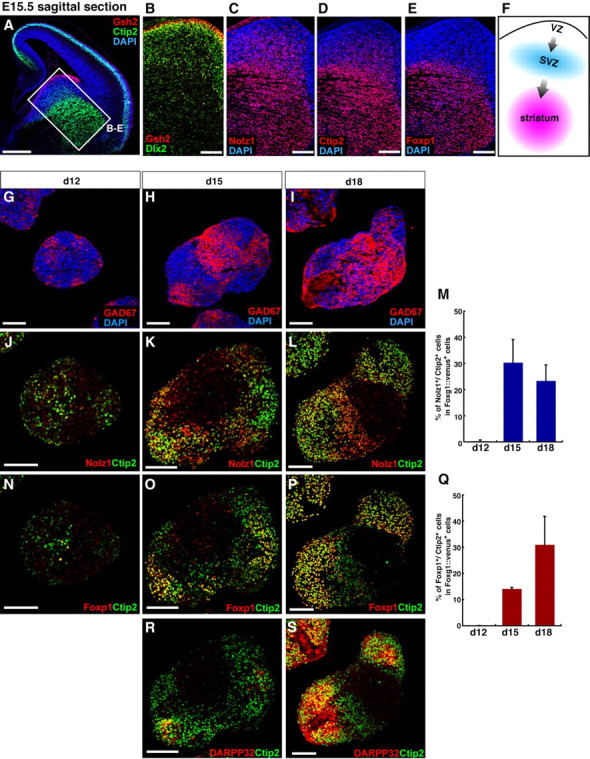
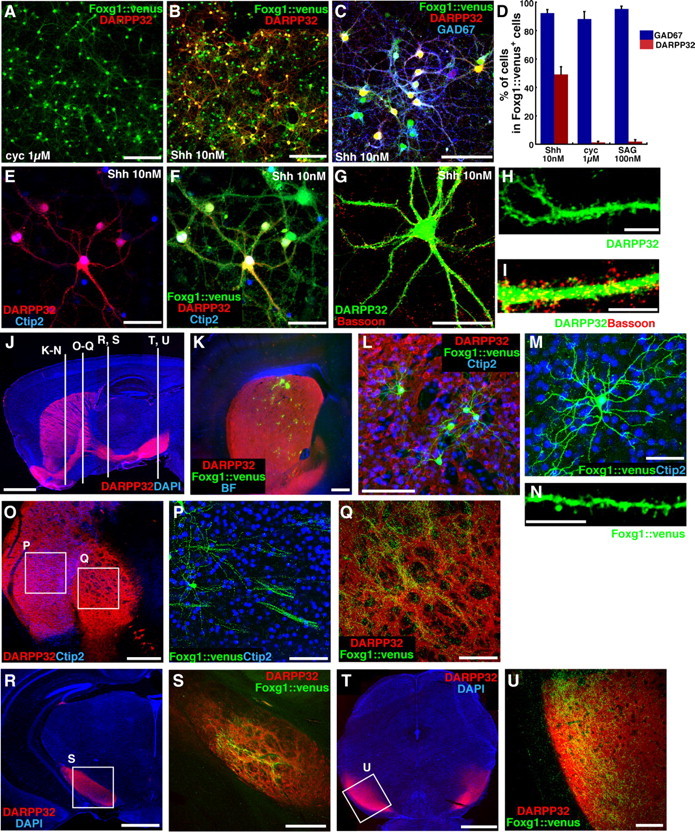
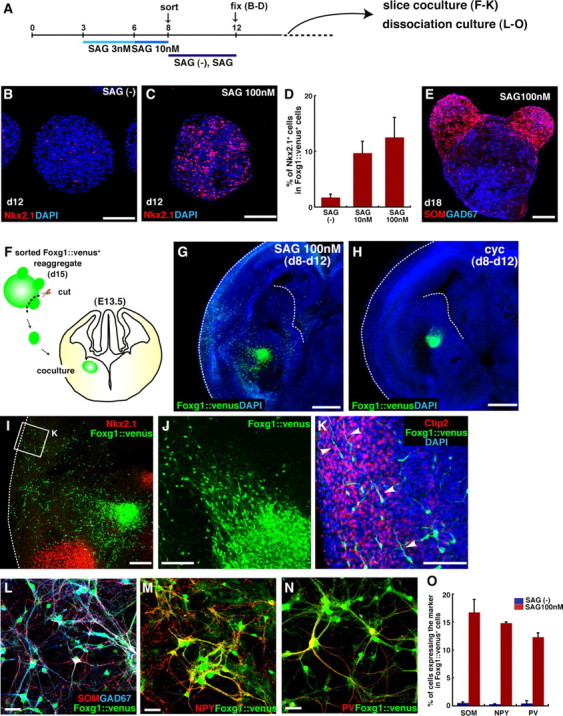
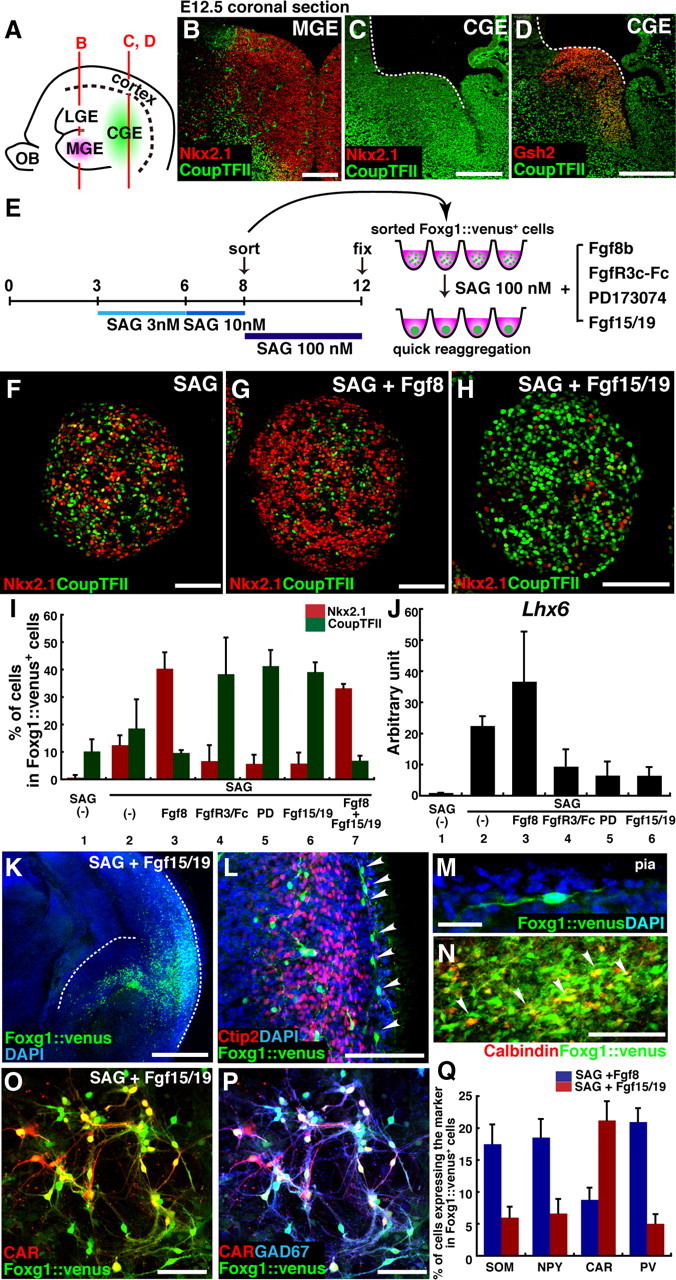
During early telencephalic development, the major portion of the ventral telencephalic (subpallial) region becomes subdivided into three regions, the lateral (LGE), medial (MGE), and caudal (CGE) ganglionic eminences. In this study, we systematically recapitulated subpallial patterning in mouse embryonic stem cell (ESC) cultures and investigated temporal and combinatory actions of patterning signals. In serum-free floating culture, the dorsal-ventral specification of ESC-derived telencephalic neuroectoderm is dose-dependently directed by Sonic hedgehog (Shh) signaling. Early Shh treatment, even before the expression onset of Foxg1 (also Bf1; earliest marker of the telencephalic lineage), is critical for efficiently generating LGE progenitors, and continuous Shh signaling until day 9 is necessary to commit these cells to the LGE lineage. When induced under these conditions and purified by fluorescence-activated cell sorter, telencephalic cells efficiently differentiated into Nolz1(+)/Ctip2(+) LGE neuronal precursors and subsequently, both in culture and after in vivo grafting, into DARPP32(+) medium-sized spiny neurons. Purified telencephalic progenitors treated with high doses of the Hedgehog (Hh) agonist SAG (Smoothened agonist) differentiated into MGE- and CGE-like tissues. Interestingly, in addition to strong Hh signaling, the efficient specification of MGE cells requires Fgf8 signaling but is inhibited by treatment with Fgf15/19. In contrast, CGE differentiation is promoted by Fgf15/19 but suppressed by Fgf8, suggesting that specific Fgf signals play different, critical roles in the positional specification of ESC-derived ventral subpallial tissues. We discuss a model of the antagonistic Fgf8 and Fgf15/19 signaling in rostral-caudal subpallial patterning and compare it with the roles of these molecules in cortical patterning.


Figures

Figure 1.
Figure 1.
Selective induction of cortex-, LGE-, and MGE-type differentiation by different levels of Shh signals in SFEBq culture. A–C, Coronal sections of the telencephalon of a wild-type mouse (A, B) and a GAD67-GFP mouse (C) at E12.5. Foxg1 (A) is widely expressed in the telencephalon. B, Region-specific neuroectodermal markers: Pax6 is expressed strongly in the cortical neuroepithelium. Gsh2 is expressed strongly in the LGE, but relatively weakly in the MGE. Nkx2.1 is mainly expressed in the MGE. C, Postmitotic neuronal markers: Tbr1 is expressed in the cortex. Dlx2 and GAD67 are expressed widely in the subpallial region. D, Schematic of the subregions of the developing telencephalon in a coronal section. E, Differentiation culture for region-specific telencephalic cells from ESCs. F–I, Serial sections of SFEBq-cultured Foxg1::venus ES cell aggregates on day 12. ESCs were cultured in condition 1. Cyclopamine (5 μm) was added on day 8. J–M, Serial sections of cell aggregates cultured in condition 2. Shh (10 nm) was added on day 3. N–Q, Serial sections of cell aggregates cultured in condition 3. Shh was added on days 3 (10 nm) and 6 (30 nm). Sections were immunostained for GFP (F, J, N), Pax6/Tbr1 (G, K, O), Gsh2/GAD67 (H, L, P), or Nkx2.1/Dlx2 (I, M, Q), and counterstained with DAPI (4′,6′-diamidino-2-phenylindole). The dotted lines outline cell aggregates (G–I, K–M, O–Q). R–U, Percentage of cells positive for the mitotic markers; Pax6 (R), Gsh2 (S), or Nkx2.1 (T), and for the postmitotic markers; Tbr1, GAD67, or Dlx2 (U). Shh (−), Culture without exogenous Shh or cyclopamine. Error bars indicate SEM. Scale bars: A, 500 μm; B, C, 200 μm; F–Q, 100 μm.
Figure 2.
Figure 2.
Temporal window for efficient subpallial differentiation in response to Shh signals. A, Temporal differences in Shh's effect on ES cell culture. B–E, Percentage of Foxg1::venus+ cells treated with cyclopamine (5 μm) from day 8, or with Shh (10 nm) from day 2, 3, 4, 5, or 6 that were positive for Pax6 (B), Tbr1 (C), Gsh2 (D), or Dlx2 (E). F, FACS sorting at different time points. Shh (10 nm) was added on day 3. G, I, Tbr1 and GAD67 expression in Foxg1::venus+ cells sorted on day 8 (G) or day 9 (I) and subsequently cultured without cyclopamine. H, J, Percentage of Foxg1::venus+ cells sorted on day 8 (H) or day 9 (J) that were positive for Tbr1+ or GAD67+. Shh (−), Cells treated without Shh or cyclopamine after sorting; cyc, cells treated with cyclopamine (1 μm) after sorting. K, LGE induction experiments, examining the effect of Shh signaling after sorting. Shh (10 nm) was added to the cell culture on day 3. Foxg1::venus+ cells were sorted and reaggregated on day 9. L–P, LGE markers (Nolz1/Ctip2) expressed in Foxg1::venus+ reaggregates treated after sorting with 1 μm cyclopamine (L), nothing (M), 10 nm Shh (N), 30 nm Shh (O), or 100 nm SAG (P). Q, SOM in Foxg1::venus+ reaggregates treated with 100 nm SAG after sorting. R, Percentage of Nolz1/Ctip2 double-labeled cells. S, qPCR analysis for the Lhx6 for the Lhx6 expression in Foxg1::venus+ reaggregates on day 15. Each lane indicates the condition after sorting. Error bars indicate SEM. Scale bars: G, I, L–Q, 100 μm.
Figure 3.
Figure 3.
Efficient in vitro striatal precursor differentiation from ESC-derived FACS-purified Foxg1+ progenitors. A–E, Sagittal sections of an E15.5 mouse telencephalon, immunostained with Gsh2 (A, B), Ctip2 (A, D), Dlx2 (B), Nolz1 (C), and Foxp1 (E), and counterstained with DAPI. F, Schematic of the migration of LGE-derived striatal neurons. G–S, Time course of LGE-type differentiation. ES cell aggregates were treated with 10 nm Shh during days 3–9, sorted and reaggregated on day 9, and cultured without Shh after sorting. Foxg1::venus+ cell aggregates were fixed on day 12 (G, J, N), day 15 (H, K, O, R), and day 18 (I, L, P, S). Sections were immunostained with GAD67 (G–I), Nolz1/Ctip2 (J–L), Foxp1/Ctip2 (N–P), or DARPP32/Ctip2 (R, S). M, Q, Percentage of Nolz1/Ctip2 (M) and Foxp1/Ctip2 (Q) double-labeled cells. Error bars indicate SEM. Scale bars: A, 500 μm; B–E, 200 μm; G–L, N–P, R, S, 100 μm.
Figure 4.
Figure 4.
ESC-derived striatal precursors mature into medium-sized spiny neurons in vitro and in vivo. A–I, Adhesion culture of LGE-type Foxg1::venus+ cells. ESCs were treated with Shh (10 nm) during days 3–9, sorted and reaggregated on day 9, redissociated and replated on day 13, and fixed on day 35. A–C, Shh signaling effect on DARPP32 after sorting. A, Cyclopamine treatment (1 μm; days 9–13). B, C, Shh treatment (10 nm; days 9–13). D, Percentage of GAD67+ and DARPP32+ cells. Each lane indicates the condition after sorting. Error bars indicate SEM. E–I, Foxg1::venus+ cells treated with 10 nm Shh after sorting (days 9–13), immunostained with DARPP32 (E–I), Ctip2 (E, F), GFP (F), and Bassoon (I; marker for presynaptic terminal). H, I, Magnified view of numerous spines on dendrites of a DARPP32+ neuron. J, Trajectory of striatonigral axon fibers in a sagittal section of the adult mouse brain, immunostained with DARPP32. K, LGE-type Foxg1::venus+ cells integrated in the striatum. L, Magnified view of grafted Foxg1::venus+ cells. M, Morphology of a grafted Foxg1::venus+ cell. N, Numerous spines were observed on a dendrite of a grafted Foxg1::venus+ cell. O–U, Grafted Foxg1::venus+ cells extended axons to the globus pallidus (O–Q), the cerebral peduncle (R, S), and the substantia nigra (T, U). P, Q, S, and U are high-magnification views of the corresponding squares in O, R, and T. Scale bars: A, B, 200 μm; C, P, L, Q, U, 100 μm; E–G, M, 50 μm; H, I, N, 10 μm; J, 2 mm; K, O, 500 μm; R, T, 1 mm; S, 300 μm.
Figure 5.
Figure 5.
MGE specification from ESC-derived FACS-purified Foxg1+ progenitors in response to high dose of SAG. A, MGE induction experiments. SAG was added on days 3 (3 nm) and 6 (10 nm). Foxg1::venus+ cells were sorted on day 8. B, C, Hh signaling effect on Nkx2.1 expression in cells with no treatment (B) and with SAG treatment (100 nm) (C) after sorting. D, Percentage of Nkx2.1+ cells in Foxg1::venus+ cells. Each lane indicates the conditions after sorting. E, SAG-treated Foxg1::venus+ cell reaggregate, immunostained on day 18. SOM+ neurons protruded from the body of the reaggregates. F, Schematic of the slice coculture for a migration assay of Foxg1::venus+ cells. G–J, Immunostaining of a slice cocultured with Foxg1::venus+ cell mass. Active migration toward the cortex was observed in Foxg1::venus+ cells treated with 100 nm SAG (G), but not in those treated with 1 μm cyclopamine (H). The dotted lines in G and H indicate the ventricular surface of the ganglionic eminences and the pial surface. I, A high-magnification view of migrating Foxg1::venus+ cells. J, Foxg1::venus+ cells migrating out of the cell mass. K, Foxg1::venus+ cells that have migrated into the lateral cortex (indicated in I). Arrowheads, Neurites extending tangentially toward the dorsal cortex. L–O, Adhesion culture of Foxg1::venus+ cell aggregates cultured in MGE conditions. Foxg1::venus+ cells were treated with 100 nm SAG after sorting, redissociated and replated on day 13, and fixed on day 35. Immunostaining with GFP (L–N), SOM (L), NPY (M), and PV (N) is shown. O, Percentage of cells positive for SOM, NPY, and PV in Foxg1::venus+ cells. Error bars indicate SEM. Scale bars: B, C, E, J, K, 100 μm; G, H, 500 μm; I, 200 μm; L–N, 50 μm.
Figure 6.
Figure 6.
Fgf signals modulate the fate of SAG-induced ventral subpallial cells. A, Schematic of the relative positions of the MGE and CGE in the sagittal view of the mouse telencephalon at E12.5. B–D, Coronal sections of the mouse telencephalon at E12.5, immunostained with Nkx2.1/CoupTFII (B, C) and CoupTFII/Gsh2 (D). E, Fgf signaling affects MGE and CGE differentiation. ES cell aggregates were treated with SAG during days 3–6 (3 nm) and days 6–8 (10 nm) and were sorted on day 8. In addition to SAG (100 nm), sorted Foxg1::venus+ cells were treated with Fgf8b (200 ng/ml), FgfR3c-Fc (100 ng/ml), PD173074 (10 nm), or Fgf15/19 (200 ng/ml). F–H, Effects of Fgf8 and Fgf15/19 on the MGE marker Nkx2.1, and on the CGE marker CoupTFII. F, SAG alone. G, SAG and Fgf8b. H, SAG and Fgf15/19. I, Percentage of Nkx2.1+ and CoupTFII+ cells in Foxg1::venus+ cells. J, qPCR analysis of the Lhx6 expression in Foxg1::venus+ cell aggregates on day 18. Each lane indicates the condition after sorting. K–N, Immunostaining of a slice cocultured with a Foxg1::venus+ cell reaggregate treated with SAG (100 nm) and Fgf15/19 (200 ng/ml) during days 8–12. K, Foxg1::venus+ cells migrating out of the reaggregate placed at the subventricular zone of the CGE. The dotted lines indicate the ventricular surface of the CGE and the pial surface. L, Foxg1::venus+ cells migrating in the marginal zone of the dorsal cortex (arrowheads). M, A high-magnification view of a migrating Foxg1::venus+ cell in the dorsal cortex. N, Some of the Foxg1::venus+ cells coexpressed calbindin (arrowheads). O, P, Dissociation adhesion culture of Foxg1::venus+ cells that were treated with SAG (100 nm) and Fgf15/19 (200 ng/ml) after sorting. The cells were dissociated and replated on day 13 and fixed on day 25. Immunostaining with GFP (O, P), CAR (O, P), and GAD67 (P) is shown. Q, Percentage of cells positive for SOM, NPY, CAR, and PV in Foxg1::venus+ cells. For SOM, NPY, and CAR, cells were analyzed on day 25; for PV, cells were analyzed on day 35. Error bars indicate SEM. Scale bars: B–D, 200 μm; F–H, L, O, P, 100 μm; K, 500 μm; M, N, 20 μm.

Similar articles

Cited by

References

    1. Agoston DV, Szemes M, Dobi A, Palkovits M, Georgopoulos K, Gyorgy A, Ring MA. Ikaros is expressed in developing striatal neurons and involved in enkephalinergic differentiation. J Neurochem. 2007;102:1805–1816. - PubMed
    1. Alvarez-Dolado M, Calcagnotto ME, Karkar KM, Southwell DG, Jones-Davis DM, Estrada RC, Rubenstein JL, Alvarez-Buylla A, Baraban SC. Cortical inhibition modified by embryonic neural precursors grafted into the postnatal brain. J Neurosci. 2006;26:7380–7389. - PMC - PubMed
    1. Anderson SA, Eisenstat DD, Shi L, Rubenstein JL. Interneuron migration from basal forebrain to neocortex: dependence on Dlx genes. Science. 1997;278:474–476. - PubMed
    1. Anderson SA, Marín O, Horn C, Jennings K, Rubenstein JL. Distinct cortical migrations from the medial and lateral ganglionic eminences. Development. 2001;128:353–363. - PubMed
    1. Aubry L, Bugi A, Lefort N, Rousseau F, Peschanski M, Perrier AL. Striatal progenitors derived from human ES cells mature into DARPP32 neurons in vitro and in quinolinic acid-lesioned rats. Proc Natl Acad Sci U S A. 2008;105:16707–16712. - PMC - PubMed

Publication types

MeSH terms

LinkOut - more resources