Non-B DNA-forming sequences and WRN deficiency independently increase the frequency of base substitution in human cells
- PMID: 21285356
- PMCID: PMC3060453
- DOI: 10.1074/jbc.M110.176636
Non-B DNA-forming sequences and WRN deficiency independently increase the frequency of base substitution in human cells
Abstract
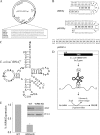
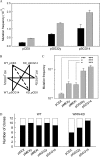
Although alternative DNA secondary structures (non-B DNA) can induce genomic rearrangements, their associated mutational spectra remain largely unknown. The helicase activity of WRN, which is absent in the human progeroid Werner syndrome, is thought to counteract this genomic instability. We determined non-B DNA-induced mutation frequencies and spectra in human U2OS osteosarcoma cells and assessed the role of WRN in isogenic knockdown (WRN-KD) cells using a supF gene mutation reporter system flanked by triplex- or Z-DNA-forming sequences. Although both non-B DNA and WRN-KD served to increase the mutation frequency, the increase afforded by WRN-KD was independent of DNA structure despite the fact that purified WRN helicase was found to resolve these structures in vitro. In U2OS cells, ∼70% of mutations comprised single-base substitutions, mostly at G·C base-pairs, with the remaining ∼30% being microdeletions. The number of mutations at G·C base-pairs in the context of NGNN/NNCN sequences correlated well with predicted free energies of base stacking and ionization potentials, suggesting a possible origin via oxidation reactions involving electron loss and subsequent electron transfer (hole migration) between neighboring bases. A set of ∼40,000 somatic mutations at G·C base pairs identified in a lung cancer genome exhibited similar correlations, implying that hole migration may also be involved. We conclude that alternative DNA conformations, WRN deficiency and lung tumorigenesis may all serve to increase the mutation rate by promoting, through diverse pathways, oxidation reactions that perturb the electron orbitals of neighboring bases. It follows that such "hole migration" is likely to play a much more widespread role in mutagenesis than previously anticipated.
Figures


Similar articles
-
Werner syndrome protein suppresses the formation of large deletions during the replication of human telomeric sequences.Cell Cycle. 2012 Aug 15;11(16):3036-44. doi: 10.4161/cc.21399. Epub 2012 Aug 8. Cell Cycle. 2012. PMID: 22871734 Free PMC article.
-
Action-at-a-distance mutagenesis induced by oxidized guanine in Werner syndrome protein-reduced human cells.Chem Res Toxicol. 2015 Apr 20;28(4):621-8. doi: 10.1021/tx500418m. Epub 2015 Mar 2. Chem Res Toxicol. 2015. PMID: 25730140
-
WRN helicase regulates the ATR-CHK1-induced S-phase checkpoint pathway in response to topoisomerase-I-DNA covalent complexes.J Cell Sci. 2011 Dec 1;124(Pt 23):3967-79. doi: 10.1242/jcs.081372. Epub 2011 Dec 8. J Cell Sci. 2011. PMID: 22159421 Free PMC article.
-
The role of WRN in DNA repair is affected by post-translational modifications.Mech Ageing Dev. 2007 Jan;128(1):50-7. doi: 10.1016/j.mad.2006.11.010. Epub 2006 Nov 20. Mech Ageing Dev. 2007. PMID: 17116323 Review.
-
Role of Werner syndrome gene product helicase in carcinogenesis and in resistance to genotoxins by cancer cells.Cancer Sci. 2008 May;99(5):843-8. doi: 10.1111/j.1349-7006.2008.00778.x. Epub 2008 Feb 26. Cancer Sci. 2008. PMID: 18312465 Free PMC article. Review.
Cited by
-
DNA secondary structure at chromosomal fragile sites in human disease.Curr Genomics. 2015 Feb;16(1):60-70. doi: 10.2174/1389202916666150114223205. Curr Genomics. 2015. PMID: 25937814 Free PMC article.
-
Deciphering the complexity of simple chromosomal insertions by genome sequencing.Hum Genet. 2021 Feb;140(2):361-380. doi: 10.1007/s00439-020-02210-x. Epub 2020 Jul 29. Hum Genet. 2021. PMID: 32728808
-
Guanine holes are prominent targets for mutation in cancer and inherited disease.PLoS Genet. 2013;9(9):e1003816. doi: 10.1371/journal.pgen.1003816. Epub 2013 Sep 26. PLoS Genet. 2013. PMID: 24086153 Free PMC article.
-
Non-B DNA: a major contributor to small- and large-scale variation in nucleotide substitution frequencies across the genome.Nucleic Acids Res. 2021 Feb 22;49(3):1497-1516. doi: 10.1093/nar/gkaa1269. Nucleic Acids Res. 2021. PMID: 33450015 Free PMC article.
-
The Werner syndrome exonuclease facilitates DNA degradation and high fidelity DNA polymerization by human DNA polymerase δ.J Biol Chem. 2012 Apr 6;287(15):12480-90. doi: 10.1074/jbc.M111.332577. Epub 2012 Feb 17. J Biol Chem. 2012. PMID: 22351772 Free PMC article.
References
Publication types
MeSH terms
Substances
Grants and funding
LinkOut - more resources
Full Text Sources
Medical

