. 2011 Jan 11;6(1):e16090.
doi: 10.1371/journal.pone.0016090.

Constitutive TL1A (TNFSF15) expression on lymphoid or myeloid cells leads to mild intestinal inflammation and fibrosis

Affiliations

Constitutive TL1A (TNFSF15) expression on lymphoid or myeloid cells leads to mild intestinal inflammation and fibrosis

David Q Shih et al. PLoS One. .

Abstract

TL1A is a member of the TNF superfamily and its expression is increased in the mucosa of inflammatory bowel disease patients. Moreover, a subset of Crohn's disease (CD) patients with the risk TL1A haplotype is associated with elevated TL1A expression and a more severe disease course. To investigate the in vivo role of elevated TL1A expression, we generated two transgenic (Tg) murine models with constitutive Tl1a expression in either lymphoid or myeloid cells. Compared to wildtype (WT) mice, constitutive expression of Tl1a in either lymphoid or myeloid cells showed mild patchy inflammation in the small intestine, which was more prominent in the ileum. In addition, mice with constitutive Tl1a expression exhibited enhanced intestinal and colonic fibrosis compared to WT littermates. The percentage of T cells expressing the gut homing chemokine receptors CCR9 and CCR10 was higher in the Tl1a Tg mice compared to WT littermates. Sustained expression of Tl1A in T cells also lead to increased Foxp3+ Treg cells. T cells or antigen presenting cells (APC) with constitutive expression of Tl1a were found to have a more activated phenotype and mucosal mononuclear cells exhibit enhanced Th1 cytokine activity. These results indicated an important role of TL1A in mucosal T cells and APC function and showed that up-regulation of TL1A expression can promote mucosal inflammation and gut fibrosis.


Conflict of interest statement

Competing Interests: The authors have declared that no competing interests exist.

Figures

Figure 1
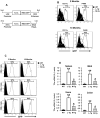
Figure 1. Generation of constitutive in vivo expression of Tl1a in T- and antigen presenting cells.
(A) Schematic of LCK-CD2-Tl1a and FMS-Tl1a transgenic construct. An internal ribosomal entry site (IRES) element is used for both transgenic constructs so that a bi-cistronic message can be made from the transgene and the Tl1a expressing cells are tagged by GFP. (B) Flow cytometric analysis of the transgene marker GFP on either CD11c or F4/80 gated splenocytes from WT (black filled), LCK-CD2-Tl1a Tg mice (L-Tg, dotted line) or FMS-Tl1a Tg mice (M-Tg, solid grey line). Representative histograms are shown. (C) Representative analysis of the transgene marker GFP on either CD3, CD4 or CD8 gated splenocytes from WT (black filled), LCK-CD2-Tl1a Tg mice (L-Tg, dotted line) or FMS-Tl1a Tg mice (solid grey line). (D) Tl1a mRNA expression was determined in the spleen, MLN, ileum or colon by real-time polymerase chain reaction. Data are expressed as mean percent of β-actin ± standard deviation (SD). *P<0.05, **P<0.01. n = 6 independent littermate mice per group were used for B-D.
Figure 2
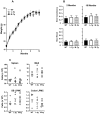
Figure 2. Phenotypic characterization of Tl1a Tg mice.
(A) Body weights for WT (grey circle), LCK-CD2-Tl1a Tg mice (L-Tg, black filled triangle) or FMS-Tl1a Tg mice (M-Tg, black filled square) are shown n = 20 per group. Data are expressed as mean weight in grams (g) ± SD. (B) Stool consistency (top panels) and fecal blood (bottom panels) were determined using standard methods from WT, LCK-CD2-Tl1a Tg (L-Tg) or FMS-Tl1a Tg mice (M-Tg) mice . Data are expressed as mean ± SD. N = 20 per group. (C) Total number of cells were isolated from spleen, MLN and lamina propria mononuclear cells (LPMC) from the colon and distal 10 cm of small intestine isolated from 10 months old WT (grey circle), LCK-CD2-Tl1a Tg (L-Tg, black triangle) or FMS-Tl1a Tg mice (M-Tg, open square) and represented as absolute cell number x 106. Each data point represents an independent mouse.
Figure 3
Figure 3. Tl1a Tg mice do not develop gross intestinal inflammation but exhibit enhanced colonic fibrosis.
(A) Gross appearance (wall thickening, hyperemia, rigidity or adhesions) of small intestine and colon are measured from 10 months old WT, LCK-CD2-Tl1a Tg (L-Tg) or FMS-Tl1a Tg (M-Tg) mice using a standard scoring system . Data are expressed as mean ± SD. (B) Myeloperoxidase (MPO) activity is measured on the distal 3 cm of ilea and mid-colon and data are expressed as arbitrary unit (U) per gram (g) of protein. *P<0.05 (C) Representative hematoxylin and eosin (H&E) stained colon section obtained from mid-colon of 10 months old WT, LCK-CD2-Tl1a Tg or FMS-Tl1a Tg mice are shown. (D) Masson Trichrome staining of collagen deposition in tissue sections of mouse mid-colon. Collagen is stained blue versus red background. There are increased blue collagen stain in LCK-CD2-Tl1a Tg and FMS-Tl1a Tg compared to WT littermate mice. Magnification 200X. Results are representative of six mice per group for A–D.
Figure 4
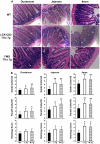
Figure 4. Constitutive Tl1a expression leads to increased numbers of goblet and Paneth cells in the small intestine and ileal histological inflammation.
(A) Representative H&E stained sections obtained from the indicated portions of small intestine from 2 months old WT, LCK-CD2-Tl1a Tg (L-Tg) or FMS-Tl1a Tg (M-Tg) mice are shown. Goblet cells are denoted by an open arrow. Paneth cells are denoted by a filled arrow. Results are representative of six mice per group. Magnification 200X. (B) The numbers of goblet (top panel) and Paneth cells (middle panel) were determined by examining at least 80 individual villi at the indicated portions of the small intestine from six mice (2 months old) per group by 2 observers blinded to mouse genotype. Data are expressed as mean (SD. Histologic scores (bottom panel) were determined by 2 observers blinded to mice using standard methods . Data are expressed as mean (SD. At least 36 fields from 6 mice per group at 200x magnification were scored. *P<0.05, **P<0.01.
Figure 5
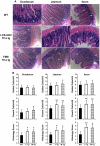
Figure 5. Persistent Paneth cell hyperplasia and worsened small intestinal inflammation as the Tl1a Tg mice aged.
(A) Representative H&E stained section obtained from the indicated portions of small intestine from 10 months old WT, LCK-CD2-Tl1a Tg (L-Tg) or FMS-Tl1a Tg (M-Tg) mice are shown. Goblet cells are denoted by an open arrow. Paneth cells are denoted by a filled arrow. Results are representative of six mice per group. Magnification 200X. (B) The numbers of goblet (top panel) and Paneth cells (middle panel) were determined by 2 observers blinded to mice genotype. Histologic scores (bottom panel) were determined from 10 months old WT, LCK-CD2-Tl1a Tg (L-Tg), or FMS-Tl1a Tg (M-Tg) mice using standard methods . Quantification of goblet and Paneth cells was determined by examining at least 80 individual villi and histological scores were determined by examining at least 36 fields at 200X magnification. Six independent mice per group were used (A–B). Data are expressed as mean (SD. *P<0.05, **P<0.01.
Figure 6
Figure 6. Increased fibrosis in the small intestine of Tl1a Tg mice.
Masson Trichrome staining was performed on mice ileal sections (distal 3 cm of small intestine). There is increased blue collagen stain in LCK-CD2-Tl1a Tg and FMS-Tl1a Tg compared to WT littermate mice. Magnification 200X. Six independent mice per group were used.
Figure 7
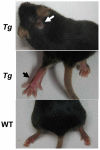
Figure 7. Tl1a transgenic mice develop ulcerated skin lesions and arthropathy.
A typical ulcerated skin lesion is illustrated (white arrow, top). Erythematous arthropathy found in the transgenic (Tg) mice is shown (black arrow, middle). A WT joint is shown in the bottom panel for comparison.
Figure 8
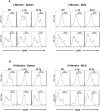
Figure 8. Sustained Tl1a expression leads to an increased percentage of activated T cells.
FACS plot of 2 month (A) and 10 month (B) splenocytes and MLN cells showing expression of activation markers CD44. Either CD4+ or CD8+ cells are gated as indicated. Data shown are representative of 4 mice per group. WT  =  wildtype, L-Tg  =  LCK-CD2-Tl1a-GFP Tg mice, M-Tg  =  FMS-Tl1a Tg mice.
Figure 9
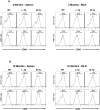
Figure 9. Sustained Tl1a expression leads to an increased percentage of activated DC and macrophages.
FACS plot of 2 month (A) and 10 month (B) splenocytes and MLN cells showing expression of activation markers CD86. Either F4/80+ or CD11c+ cells were gated as indicated. Data shown are representative of 4 mice per group. WT  =  wildtype, L-Tg  =  LCK-CD2-Tl1a-GFP Tg mice, M-Tg  =  FMS-Tl1a Tg mice.
Figure 10
Figure 10. Increased numbers of regulatory T (Treg) cells in Tl1a Tg mice.
FACS plot of CD4 + Foxp3+ splenocytes (A) or CD4 + Foxp3+ MLN cells (B) are shown. Data shown are representative of 4 mice per group at either 2 or 10 months of age. WT  =  wildtype, L-Tg  =  LCK-CD2-Tl1a-GFP Tg mice, M-Tg  =  FMS-Tl1a-GFP Tg mice.
Figure 11
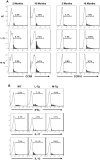
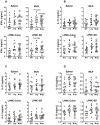
Figure 11. Increased expression of gut homing markers and IFN-γ in Tl1a Tg mice.
(A) FACS plots showing expression of gut homing markers CCR9 and CCR10 on CD4+ cells isolated from the MLN. (B) FACS plot of gated CD4+ cells from MLN and stained for intracellular IFN-γ, IL-17, and IL-13 expression from 10 months old WT, LCK-CD2-Tl1a Tg (L-Tg) or FMS-Tl1a Tg (M-Tg) mice. Data shown are representative of 4 mice per group (A and B). Black bars indicate area under the curve that is gated as CCR9 positive cells. WT  =  wildtype, L-Tg  =  LCK-CD2-Tl1a-GFP Tg mice, M-Tg  =  FMS-Tl1a Tg mice.
Figure 12
Figure 12. Cytokine profile of Tl1a Tg and WT littermate mice.
IFN-γ (A), IL-17 (B), IL-13 (C) and IL-10 (D) secretion after stimulation with anti-CD3 and anti-CD28 were assessed by enzyme-linked immunosorbent assay (ELISA). Each data point (A-D) represents cytokine expression for either splenocytes, MLN cells or lamina propria mononuclear cells (LPMC) from either the colon or the distal 10 cm of small intestine isolated from an individual mouse. p-values are indicated the figure where significant. WT  =  wildtype, L-Tg  =  LCK-CD2-Tl1a-GFP Tg mice, M-Tg  =  FMS-Tl1a Tg mice.

Similar articles

Cited by

References

    1. Shih DQ, Targan SR. Insights into IBD Pathogenesis. Curr Gastroenterol Rep. 2009;11:473–480. - PMC - PubMed
    1. Shih DQ, Targan SR, McGovern D. Recent advances in IBD pathogenesis: genetics and immunobiology. Curr Gastroenterol Rep. 2008;10:568–575. - PMC - PubMed
    1. Stappenbeck TS, Rioux JD, Mizoguchi A, Saitoh T, Huett A, et al. Crohn disease: A current perspective on genetics, autophagy and immunity. Autophagy. 2010;7:Epub ahead of print. - PMC - PubMed
    1. Prehn JL, Mehdizadeh S, Landers CJ, Luo X, Cha SC, et al. Potential role for TL1A, the new TNF-family member and potent costimulator of IFN-gamma, in mucosal inflammation. Clin Immunol. 2004;112:66–77. - PubMed
    1. Papadakis KA, Prehn JL, Landers C, Han Q, Luo X, et al. TL1A synergizes with IL-12 and IL-18 to enhance IFN-gamma production in human T cells and NK cells. J Immunol. 2004;172:7002–7007. - PubMed

Publication types

MeSH terms

Substances