

Two-stage cooperative T cell receptor-peptide major histocompatibility complex-CD8 trimolecular interactions amplify antigen discrimination
- PMID: 21256056
- PMCID: PMC3381515
- DOI: 10.1016/j.immuni.2010.12.017
Two-stage cooperative T cell receptor-peptide major histocompatibility complex-CD8 trimolecular interactions amplify antigen discrimination
Abstract
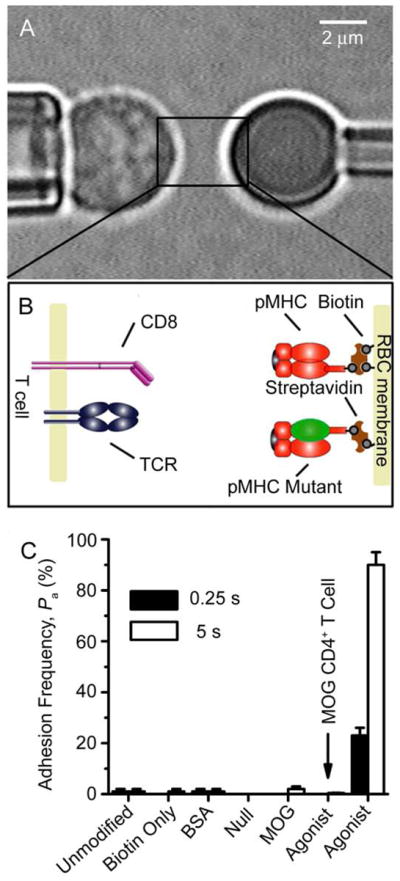
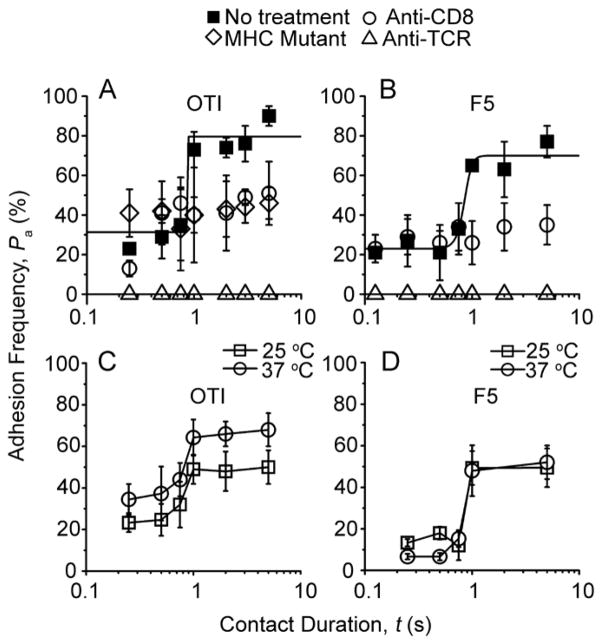
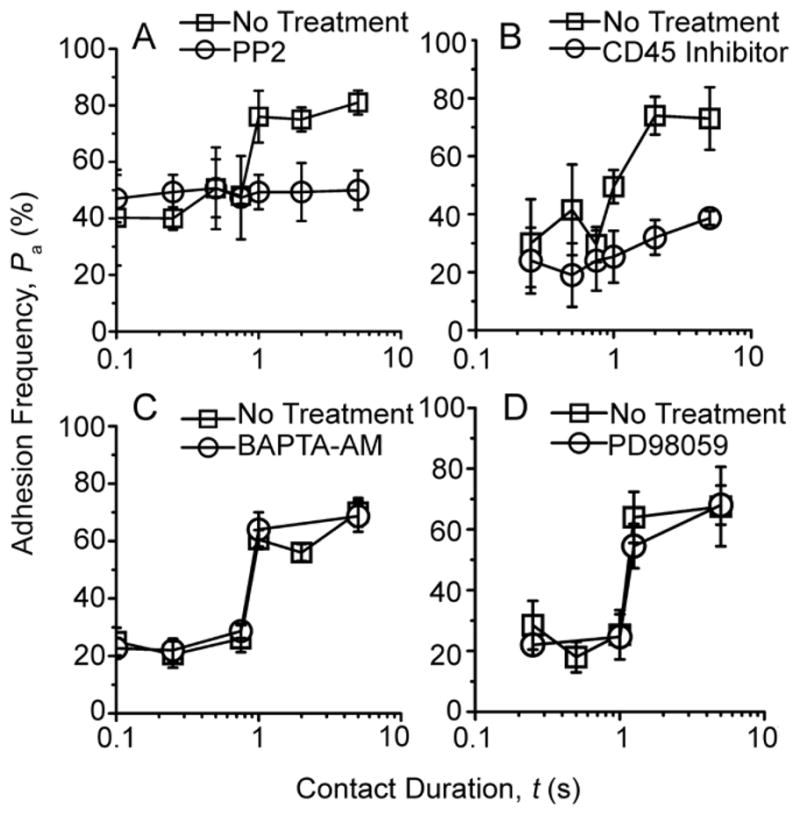
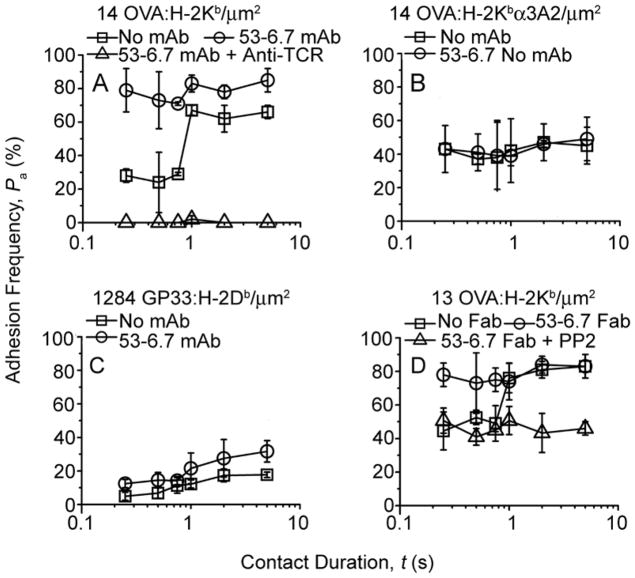
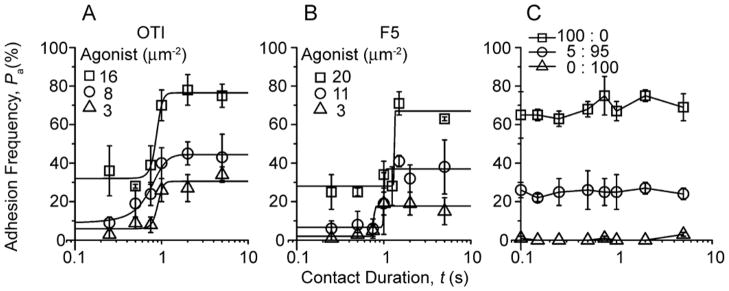
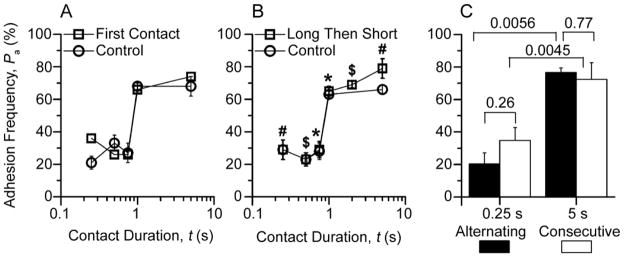
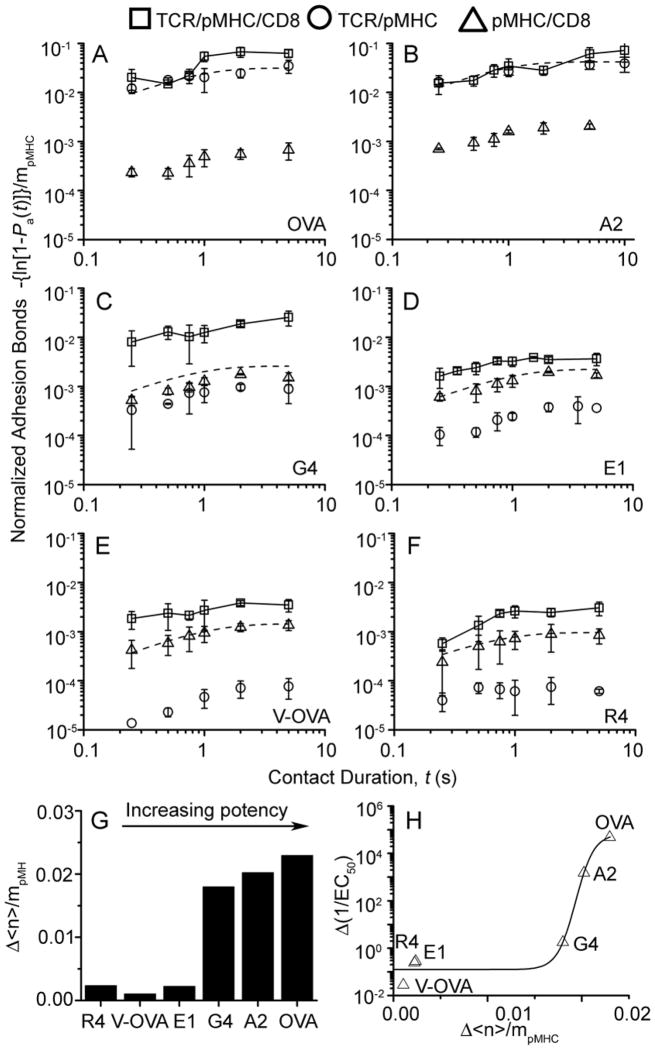
The T cell receptor (TCR) and CD8 bind peptide-major histocompatibility complex (pMHC) glycoproteins to initiate adaptive immune responses, yet the trimolecular binding kinetics at the T cell membrane is unknown. By using a micropipette adhesion frequency assay, we show that this kinetics has two stages. The first consists of TCR-dominant binding to agonist pMHC. This triggers a second stage consisting of a step increase in adhesion after a one second delay. The second-stage binding requires Src family kinase activity to initiate CD8 binding to the same pMHC engaged by the TCR. This induced trimeric-cooperative interaction enhances adhesion synergistically to favor potent ligands, which further amplifies discrimination. Our data reveal a TCR-CD8 positive-feedback loop involved in initial signaling steps that is sensitive to a single pMHC is rapid, reversible, synergistic, and peptide discriminative.
Copyright © 2011 Elsevier Inc. All rights reserved.
Conflict of interest statement
We have no conflict of interest to declare.
Figures
Comment in
-
Late arrival: recruiting coreceptors to the T cell receptor complex.Immunity. 2011 Jan 28;34(1):1-3. doi: 10.1016/j.immuni.2011.01.001. Immunity. 2011. PMID: 21272780
Similar articles
-
PD-1 suppresses TCR-CD8 cooperativity during T-cell antigen recognition.Nat Commun. 2021 May 12;12(1):2746. doi: 10.1038/s41467-021-22965-9. Nat Commun. 2021. PMID: 33980853 Free PMC article.
-
Early T cell receptor signals globally modulate ligand:receptor affinities during antigen discrimination.Proc Natl Acad Sci U S A. 2017 Nov 14;114(46):12190-12195. doi: 10.1073/pnas.1613140114. Epub 2017 Oct 30. Proc Natl Acad Sci U S A. 2017. PMID: 29087297 Free PMC article.
-
Decreased binding of peptides-MHC class I (pMHC) multimeric complexes to CD8 affects their binding avidity for the TCR but does not significantly impact on pMHC/TCR dissociation rate.J Immunol. 2003 May 15;170(10):5110-7. doi: 10.4049/jimmunol.170.10.5110. J Immunol. 2003. PMID: 12734357
-
Insights from in situ analysis of TCR-pMHC recognition: response of an interaction network.Immunol Rev. 2013 Jan;251(1):49-64. doi: 10.1111/imr.12016. Immunol Rev. 2013. PMID: 23278740 Free PMC article. Review.
-
Suboptimal engagement of the T-cell receptor by a variety of peptide-MHC ligands triggers T-cell anergy.Immunology. 2010 Jan;129(1):1-7. doi: 10.1111/j.1365-2567.2009.03206.x. Epub 2009 Dec 2. Immunology. 2010. PMID: 20002785 Free PMC article. Review.
Cited by
-
CD8 Co-Receptor Enhances T-Cell Activation without Any Effect on Initial Attachment.Cells. 2021 Feb 18;10(2):429. doi: 10.3390/cells10020429. Cells. 2021. PMID: 33670573 Free PMC article.
-
Low 2-dimensional CD4 T cell receptor affinity for myelin sets in motion delayed response kinetics.PLoS One. 2012;7(3):e32562. doi: 10.1371/journal.pone.0032562. Epub 2012 Mar 7. PLoS One. 2012. PMID: 22412888 Free PMC article.
-
Strategies and rules for tuning TCR-derived therapy.Expert Rev Mol Med. 2023 Dec 14;26:e4. doi: 10.1017/erm.2023.27. Expert Rev Mol Med. 2023. PMID: 38095091 Free PMC article. Review.
-
T-Cell Mechanobiology: Force Sensation, Potentiation, and Translation.Front Phys. 2019 Apr;7:45. doi: 10.3389/fphy.2019.00045. Epub 2019 Apr 2. Front Phys. 2019. PMID: 32601597 Free PMC article.
-
TCR-pMHC bond conformation controls TCR ligand discrimination.Cell Mol Immunol. 2020 Mar;17(3):203-217. doi: 10.1038/s41423-019-0273-6. Epub 2019 Sep 17. Cell Mol Immunol. 2020. PMID: 31530899 Free PMC article.
References
-
- Alam SM, Travers PJ, Wung JL, Nasholds W, Redpath S, Jameson SC, Gascoigne NR. T-cell-receptor affinity and thymocyte positive selection. Nature. 1996;381:616–620. - PubMed
-
- Campanelli R, Palermo B, Garbelli S, Mantovani S, Lucchi P, Necker A, Lantelme E, Giachino C. Human CD8 co-receptor is strictly involved in MHC-peptide tetramer-TCR binding and T cell activation. Int Immunol. 2002;14:39–44. - PubMed
Publication types
MeSH terms
Substances
Grants and funding
LinkOut - more resources
Full Text Sources
Other Literature Sources
Molecular Biology Databases
Research Materials
Miscellaneous
