Scarecrow-like 3 promotes gibberellin signaling by antagonizing master growth repressor DELLA in Arabidopsis
- PMID: 21245327
- PMCID: PMC3033277
- DOI: 10.1073/pnas.1012232108
Scarecrow-like 3 promotes gibberellin signaling by antagonizing master growth repressor DELLA in Arabidopsis
Abstract
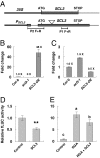
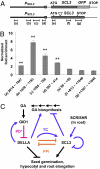
The diterpenoid phytohormone gibberellin (GA) controls diverse developmental processes throughout the plant life cycle. DELLA proteins are master growth repressors that function immediately downstream of the GA receptor to inhibit GA signaling. By doing so, DELLAs also play pivotal roles as integrators of internal developmental signals from multiple hormone pathways and external cues. DELLAs are likely nuclear transcriptional regulators, which interact with other transcription factors to modulate expression of GA-responsive genes. DELLAs are also involved in maintaining GA homeostasis through feedback up-regulating expression of GA biosynthesis and receptor genes. However, the molecular mechanisms by which DELLAs restrict growth and development are largely unknown. This study reveals an important step of the mechanism. Previous microarray studies identified scarecrow-like 3 (SCL3) as a direct target gene of DELLA in Arabidopsis seedlings. SCL3 expression is induced by DELLA and repressed by GA. Unexpectedly, a scl3 null mutant displays reduced GA responses and elevated expression of GA biosynthesis genes during seed germination and seedling growth, indicating that SCL3 functions as a positive regulator of GA signaling. SCL3 seems to act as an attenuator of DELLA proteins. Transient expression, ChIP, and co-IP studies show that SCL3 autoregulates its own transcription by directly interacting with DELLA. Our data further show that SCL3 and DELLA antagonize each other in controlling both downstream GA responses and upstream GA biosynthetic genes. This work is beginning to shed light on how this complex regulatory network achieves GA homeostasis and controls GA-mediated growth and development in the plant.
Conflict of interest statement
The authors declare no conflict of interest.
Figures


Similar articles
-
SCARECROW-LIKE3 regulates the transcription of gibberellin-related genes by acting as a transcriptional co-repressor of GAI-ASSOCIATED FACTOR1.Plant Mol Biol. 2021 Mar;105(4-5):463-482. doi: 10.1007/s11103-020-01101-z. Epub 2021 Jan 21. Plant Mol Biol. 2021. PMID: 33474657
-
DELLA and SCL3 balance gibberellin feedback regulation by utilizing INDETERMINATE DOMAIN proteins as transcriptional scaffolds.Plant Signal Behav. 2014;9(9):e29726. doi: 10.4161/psb.29726. Plant Signal Behav. 2014. PMID: 25763707 Free PMC article. Review.
-
Global analysis of della direct targets in early gibberellin signaling in Arabidopsis.Plant Cell. 2007 Oct;19(10):3037-57. doi: 10.1105/tpc.107.054999. Epub 2007 Oct 12. Plant Cell. 2007. PMID: 17933900 Free PMC article.
-
SEUSS Integrates Gibberellin Signaling with Transcriptional Inputs from the SHR-SCR-SCL3 Module to Regulate Middle Cortex Formation in the Arabidopsis Root.Plant Physiol. 2016 Mar;170(3):1675-83. doi: 10.1104/pp.15.01501. Epub 2016 Jan 27. Plant Physiol. 2016. PMID: 26818732 Free PMC article.
-
Gibberellins and abscisic acid signal crosstalk: living and developing under unfavorable conditions.Plant Cell Rep. 2013 Jul;32(7):1007-16. doi: 10.1007/s00299-013-1409-2. Epub 2013 Mar 23. Plant Cell Rep. 2013. PMID: 23525744 Review.
Cited by
-
Analyzing serial cDNA libraries revealed reactive oxygen species and gibberellins signaling pathways in the salt response of Upland cotton (Gossypium hirsutum L.).Plant Cell Rep. 2015 Jun;34(6):1005-23. doi: 10.1007/s00299-015-1761-5. Epub 2015 Feb 21. Plant Cell Rep. 2015. PMID: 25700980
-
Control of Asymmetric Cell Divisions during Root Ground Tissue Maturation.Mol Cells. 2016 Jul;39(7):524-9. doi: 10.14348/molcells.2016.0105. Epub 2016 Jun 16. Mol Cells. 2016. PMID: 27306644 Free PMC article. Review.
-
Effector-Triggered Immune Response in Arabidopsis thaliana Is a Quantitative Trait.Genetics. 2016 Sep;204(1):337-53. doi: 10.1534/genetics.116.190678. Epub 2016 Jul 13. Genetics. 2016. PMID: 27412712 Free PMC article.
-
A Regulatory Module Controlling GA-Mediated Endosperm Cell Expansion Is Critical for Seed Germination in Arabidopsis.Mol Plant. 2019 Jan 7;12(1):71-85. doi: 10.1016/j.molp.2018.10.009. Epub 2018 Nov 10. Mol Plant. 2019. PMID: 30419294 Free PMC article.
-
Drought-Tolerance QTLs Associated with Grain Yield and Related Traits in Spring Bread Wheat.Plants (Basel). 2022 Apr 4;11(7):986. doi: 10.3390/plants11070986. Plants (Basel). 2022. PMID: 35406966 Free PMC article.
References
-
- Ueguchi-Tanaka M, Nakajima M, Motoyuki A, Matsuoka M. Gibberellin receptor and its role in gibberellin signaling in plants. Annu Rev Plant Biol. 2007;58:183–198. - PubMed
-
- Fleet CM, Sun TP. A DELLAcate balance: The role of gibberellin in plant morphogenesis. Curr Opin Plant Biol. 2005;8:77–85. - PubMed
-
- Achard P, Genschik P. Releasing the brakes of plant growth: How GAs shutdown DELLA proteins. J Exp Bot. 2009;60:1085–1092. - PubMed
-
- Sun TP, Gubler F. Molecular mechanism of gibberellin signaling in plants. Annu Rev Plant Biol. 2004;55:197–223. - PubMed
Publication types
MeSH terms
Substances
LinkOut - more resources
Full Text Sources
Molecular Biology Databases

